Tweeted twitter.com/StackMma/status/757600020216606725
deleted 49 characters in body
Source Link
user9660
user9660

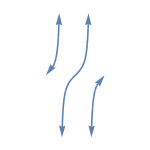
I want to add arrows to the start and the end of the Tangent curve. My first try was successful,

Graphics[{First@Plot[Tan[x], {x, -Pi, Pi}, Exclusions -> {-Pi/2,  
Pi/2}]}, PlotRange -> 8] /. Line[x_] :> {Arrowheads[{-0.08, 0.08}],  
Arrow[x]}

enter image description here

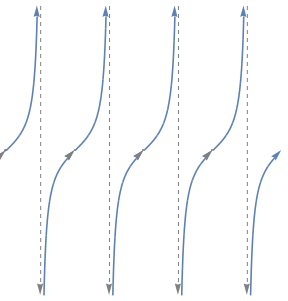
but in my next try I get extraneous gray arrows over the curve,

Graphics[{ First@Plot[Tan[x], {x, -2 Pi, 2 Pi},  
Exclusions -> Range[-2 Pi, 2 Pi,Pi/2],                                                                   ExclusionsStyle ->  
Directive[{Gray, Dashed}],
  Ticks -> {Range[-2 Pi, 2 Pi, Pi/2],  
Automatic}, 
 ImageSize -> 100] /. Line[x_] :> {Arrowheads[0.04],  
Arrow[x]}
  }]

enter image description here

How I can remove these arrows?

I want to add arrows to the start and the end of the Tangent curve. My first try was successful,

Graphics[{First@Plot[Tan[x], {x, -Pi, Pi}, Exclusions -> {-Pi/2, Pi/2}]}, PlotRange -> 8] /. Line[x_] :> {Arrowheads[{-0.08, 0.08}], Arrow[x]}

enter image description here

but in my next try I get extraneous gray arrows over the curve,

Graphics[{ First@Plot[Tan[x], {x, -2 Pi, 2 Pi}, Exclusions -> Range[-2 Pi, 2 Pi,Pi/2],                                                                   ExclusionsStyle -> Directive[{Gray, Dashed}],
 Ticks -> {Range[-2 Pi, 2 Pi, Pi/2], Automatic}, 
 ImageSize -> 100] /. Line[x_] :> {Arrowheads[0.04], Arrow[x]}
  }]

enter image description here

How I can remove these arrows?

I want to add arrows to the start and the end of the Tangent curve. My first try was successful,

Graphics[{First@Plot[Tan[x], {x, -Pi, Pi}, Exclusions -> {-Pi/2,  
Pi/2}]}, PlotRange -> 8] /. Line[x_] :> {Arrowheads[{-0.08, 0.08}],  
Arrow[x]}

enter image description here

but in my next try I get extraneous gray arrows over the curve,

Graphics[{ First@Plot[Tan[x], {x, -2 Pi, 2 Pi},  
Exclusions -> Range[-2 Pi, 2 Pi,Pi/2], ExclusionsStyle ->  
Directive[{Gray, Dashed}], Ticks -> {Range[-2 Pi, 2 Pi, Pi/2],  
Automatic}, ImageSize -> 100] /. Line[x_] :> {Arrowheads[0.04],  
Arrow[x]}}]

enter image description here

How I can remove these arrows?

Source Link
wmora2
  • 599
  • 3
  • 10

Adding arrows in Tangent

I want to add arrows to the start and the end of the Tangent curve. My first try was successful,

Graphics[{First@Plot[Tan[x], {x, -Pi, Pi}, Exclusions -> {-Pi/2, Pi/2}]}, PlotRange -> 8] /. Line[x_] :> {Arrowheads[{-0.08, 0.08}], Arrow[x]}

enter image description here

but in my next try I get extraneous gray arrows over the curve,

Graphics[{ First@Plot[Tan[x], {x, -2 Pi, 2 Pi}, Exclusions -> Range[-2 Pi, 2 Pi,Pi/2],                                                                   ExclusionsStyle -> Directive[{Gray, Dashed}],
Ticks -> {Range[-2 Pi, 2 Pi, Pi/2], Automatic}, 
ImageSize -> 100] /. Line[x_] :> {Arrowheads[0.04], Arrow[x]}
  }]

enter image description here

How I can remove these arrows?