9
$\begingroup$

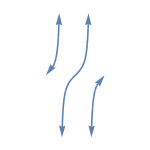
I want to add arrows to the start and the end of the Tangent curve. My first try was successful,

Graphics[{First@Plot[Tan[x], {x, -Pi, Pi}, Exclusions -> {-Pi/2, 
Pi/2}]}, PlotRange -> 8] /. Line[x_] :> {Arrowheads[{-0.08, 0.08}], 
Arrow[x]}

enter image description here

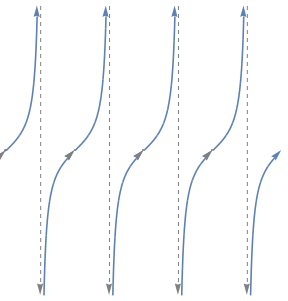
but in my next try I get extraneous gray arrows over the curve,

Graphics[{ First@Plot[Tan[x], {x, -2 Pi, 2 Pi}, 
Exclusions -> Range[-2 Pi, 2 Pi,Pi/2], ExclusionsStyle -> 
Directive[{Gray, Dashed}], Ticks -> {Range[-2 Pi, 2 Pi, Pi/2], 
Automatic}, ImageSize -> 100] /. Line[x_] :> {Arrowheads[0.04], 
Arrow[x]}}]

enter image description here

How I can remove these arrows?

$\endgroup$
0

2 Answers 2

12
$\begingroup$

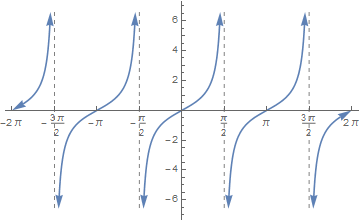
This should do it:

Plot[Tan[x], {x, -2 π, 2 π}, 
     Exclusions -> Range[-3 π/2, 3 π/2, π], 
     ExclusionsStyle -> Directive[Gray, Dashed, Arrowheads[{}]], 
     PlotStyle -> Arrowheads[0.04 {-1, 1}], 
     Ticks -> {Range[-2 π, 2 π, π/2], Automatic}] /. Line -> Arrow

tangent function with arrows

$\endgroup$
7
$\begingroup$

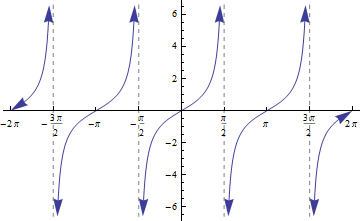
You can also change Lines to Arrows using PlotStyle as follows:

Plot[Tan[x], {x, -2 π, 2 π},
 Exclusions -> Range[-3 π/2, 3 π/2, π], 
 ExclusionsStyle -> Directive[Gray, Dashed], 
 PlotStyle -> ({Arrowheads[{-.05, .05}], Arrow @@ #} &),
 Ticks -> {Range[-2 π, 2 π, π/2], Automatic}]

Mathematica graphics

$\endgroup$
1
  • 1
    $\begingroup$ In which version was this capability introduced? $\endgroup$
    – Mr.Wizard
    Commented Jul 28, 2016 at 6:33

Your Answer

By clicking “Post Your Answer”, you agree to our terms of service and acknowledge you have read our privacy policy.

Not the answer you're looking for? Browse other questions tagged or ask your own question.