"artifact" is the more common spelling
Source Link

3D graphics rendering artefactartifact with overlapping planes (z-fighting)

I am trying to render a matrix as a depth map:

data = {{1, 1, 1, 1}, {1, 0, 3, 1}, {2, 0, 0, 1}};
ListPlot3D[data, Mesh -> None, InterpolationOrder -> 0, 
           Filling -> Bottom, FillingStyle -> {Opacity[1]}, 
           ColorFunction -> "SolarColors", ViewPoint -> {Pi, Pi, 5}]

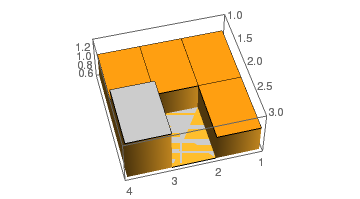
my depth map

However, for the matrix element with the lowest value, the height of the corresponding bar in the plot is zero. This results in rendering artefactsartifacts (z-fighting).

Viewing the graph from below or rotating the graph makes the problem more obvious:

see the artefactssee the artifacts

3D graphics rendering artefact with overlapping planes (z-fighting)

I am trying to render a matrix as a depth map:

data = {{1, 1, 1, 1}, {1, 0, 3, 1}, {2, 0, 0, 1}};
ListPlot3D[data, Mesh -> None, InterpolationOrder -> 0, 
           Filling -> Bottom, FillingStyle -> {Opacity[1]}, 
           ColorFunction -> "SolarColors", ViewPoint -> {Pi, Pi, 5}]

my depth map

However, for the matrix element with the lowest value, the height of the corresponding bar in the plot is zero. This results in rendering artefacts (z-fighting).

Viewing the graph from below or rotating the graph makes the problem more obvious:
see the artefacts

3D graphics rendering artifact with overlapping planes (z-fighting)

I am trying to render a matrix as a depth map:

data = {{1, 1, 1, 1}, {1, 0, 3, 1}, {2, 0, 0, 1}};
ListPlot3D[data, Mesh -> None, InterpolationOrder -> 0, 
           Filling -> Bottom, FillingStyle -> {Opacity[1]}, 
           ColorFunction -> "SolarColors", ViewPoint -> {Pi, Pi, 5}]

my depth map

However, for the matrix element with the lowest value, the height of the corresponding bar in the plot is zero. This results in rendering artifacts (z-fighting).

Viewing the graph from below or rotating the graph makes the problem more obvious:
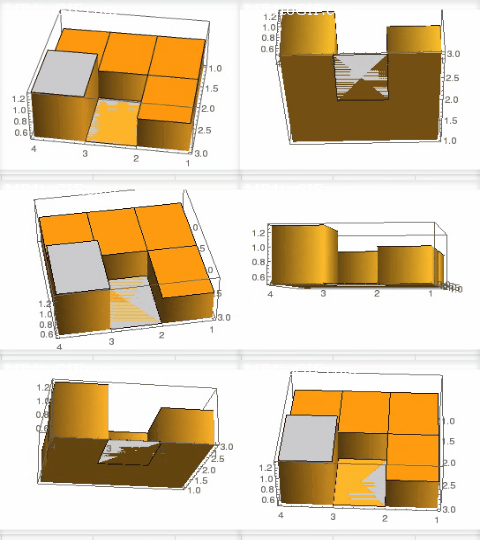
see the artifacts

edited tags; edited title
Link
István Zachar
  • 47.2k
  • 20
  • 145
  • 293

3D Plot Rendering Artefactsgraphics rendering artefact with overlapping planes (z-fighting)

deleted 25 characters in body; edited title
Source Link

3DPlot 3D Plot Rendering Artefacts (z-fighting)

I am trying to render a matrix as a depth map:

data = {{1, 1, 1, 1}, {1, 0, 3, 1}, {2, 0, 0, 1}};
ListPlot3D[data, Mesh -> None, InterpolationOrder -> 0, 
           Filling -> Bottom, FillingStyle -> {Opacity[1]}, 
           ColorFunction -> "SolarColors", ViewPoint -> {Pi, Pi, 5}]

enter image description heremy depth map

However, for the matrix element with the lowest value, the height of the respectivecorresponding bar in the plot is zero. The result areThis results in rendering artefacts (z-fighting).

Viewing the graph from below or rotating the graph makes the problem more obvious:

enter image description heresee the artefacts

3DPlot Rendering Artefacts (z-fighting)

I am trying to render a matrix as a depth map:

data = {{1, 1, 1, 1}, {1, 0, 3, 1}, {2, 0, 0, 1}};
ListPlot3D[data, Mesh -> None, InterpolationOrder -> 0, 
           Filling -> Bottom, FillingStyle -> {Opacity[1]}, 
           ColorFunction -> "SolarColors", ViewPoint -> {Pi, Pi, 5}]

enter image description here

However, for the matrix element with the lowest value, the height of the respective bar in the plot is zero. The result are rendering artefacts (z-fighting).

Viewing the graph from below or rotating the graph makes the problem more obvious:

enter image description here

3D Plot Rendering Artefacts (z-fighting)

I am trying to render a matrix as a depth map:

data = {{1, 1, 1, 1}, {1, 0, 3, 1}, {2, 0, 0, 1}};
ListPlot3D[data, Mesh -> None, InterpolationOrder -> 0, 
           Filling -> Bottom, FillingStyle -> {Opacity[1]}, 
           ColorFunction -> "SolarColors", ViewPoint -> {Pi, Pi, 5}]

my depth map

However, for the matrix element with the lowest value, the height of the corresponding bar in the plot is zero. This results in rendering artefacts (z-fighting).

Viewing the graph from below or rotating the graph makes the problem more obvious:

see the artefacts

edited tags
Link
Alexey Popkov
  • 62.3k
  • 7
  • 154
  • 375
Loading
adding animation
Source Link
R D
  • 283
  • 1
  • 4
Loading
Source Link
R D
  • 283
  • 1
  • 4
Loading