6
$\begingroup$

I often have the following notebook in Mathematica, which I use to make a dataset and associated errors:

x = {0, 2, 4, 6, 10, 20};
y = {979, 146, 141, 157, 187, 274};
uncY = Sqrt[y];
dataVector = Thread[{x, y}];

I want to make an ErrorListPlot, so I need to add ErrorBar with each uncY-value as an element in each data pair. So the final dataVector should have the form

{{x_i, y_i}, Errorbar[uncY_i]}

What is an easy way to achieve this, without using a For-loop?

$\endgroup$
1
  • $\begingroup$ @andre why is that? is it too specific? $\endgroup$
    – BillyJean
    Commented Mar 23, 2013 at 21:29

3 Answers 3

9
$\begingroup$

If your errors input has the form :

errorList = {1, 2, 1, 3, 1, 2}

Then do :

Thread[{dataVector, Errorbar /@ errorList}]  

(* {  
 {{0, 979}, Errorbar[1]},
 {{2, 146}, Errorbar[2]},
 {{4, 141}, Errorbar[1]},
 {{6, 157}, Errorbar[3]},
 {{10, 187}, Errorbar[1]},
 {{20, 274}, Errorbar[2]}
 } *)
$\endgroup$
5
$\begingroup$

You can do all the manipulation in one line if you wish:

ErrorListPlot@MapThread[{{#1, #2}, ErrorBar[#2-uncY@#2 ]} &, {x, y}]
$\endgroup$
2
  • $\begingroup$ I would thumb-up if I had sufficient reputation $\endgroup$
    – BillyJean
    Commented Mar 23, 2013 at 21:30
  • $\begingroup$ I'll take a virtual thumbs up, cheers ;) $\endgroup$ Commented Mar 24, 2013 at 0:32
4
$\begingroup$

I accidentally discovered that you can use convenient notation PlusMinus(±) for horizontal and vertical axes

ypm = Thread[y ± uncY]

enter image description here

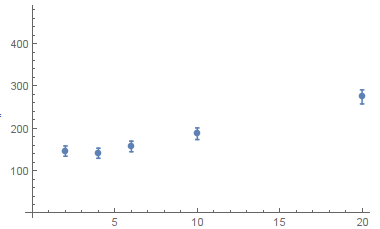
ErrorListPlot[Thread[{x, ypm}]]

enter image description here

In your case you can use even more simple method as mentioned here:

ErrorListPlot[Thread[{x, y, uncY}]] 

Unfortunately, these nice options are still undocumented.

$\endgroup$

Your Answer

By clicking “Post Your Answer”, you agree to our terms of service and acknowledge you have read our privacy policy.

Not the answer you're looking for? Browse other questions tagged or ask your own question.