I have been trying to make code work for iterating piecewise linear maps on the unit interval in Mathematica to compare with MATLAB and Maple. Tent and logistic maps are easy to implement but Bernoulli and other non-traditional maps have been difficult (at least for me). I wish to investigate histograms of the invariant densities of map iterations for non periodic orbits.
1 Answer
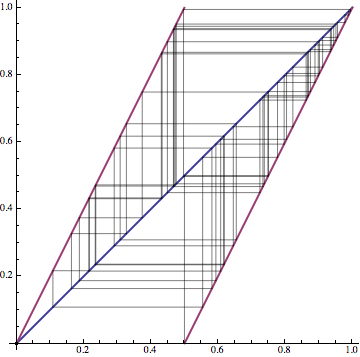
This is a great problem to illustrate the use of Mathematica's significance tracking. First, let's define a piecewise map in a fairly general way, compute 1000 terms of a known non-periodic orbit, and illustrate with an orbit diagram.
f[x_] = Piecewise[{
  {2 x, 0 <= x < 1/2},
  {2 x - 1, 1/2 <= x <= 1}
}];
orbit = NestList[f, N[1/GoldenRatio], 1000];
lines = Partition[Flatten[{#, #, #, #} & /@ orbit][[2 ;; -2]], 2];
Plot[{x, f[x]}, {x, 0, 1},
  AspectRatio -> Automatic,
  Epilog -> {Opacity[0.5], Line /@ Partition[lines, 2, 1]},
  PlotStyle -> Thick]

Hmm... If you've worked with chaotic orbits at all, this looks fairly tame. The problem is that your map is known to lose one bit of precision with each iterate thus, at machine precision, you lose all significange after about 53 iterates. You certainly don't want to use exact numbers as the expression swell will typically be unmanagable.
Nest[f, 1/GoldenRatio, 10] // InputForm

(* Out: 8*(-1+2*(-1+2*(-1+2*(-1+8*(-1+2/GoldenRatio))))) *)
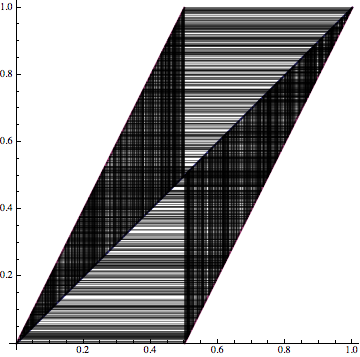
One solution is to use higher precision.
orbit = NestList[f, N[1/GoldenRatio, 302], 1000];
lines = Partition[Flatten[{#, #, #, #} & /@ orbit][[2 ;; -2]], 2];
Plot[{x, f[x]}, {x, 0, 1},
  AspectRatio -> Automatic,
  Epilog -> {Opacity[0.5], Line /@ Partition[N[lines, 20], 2, 1]},
  PlotStyle -> Thick]

The last term only has about one digit of precision left.
Last[orbit]

(* Out: 0.3 *)
Again, this is because the map loses one bit of precision with each iterate. If we want to iterate $n$ times, we should solve the following equation.
Solve[2.0^1000 == 10.0^(n - 1), n]

(* Out: {{x -> 302.03}} *)
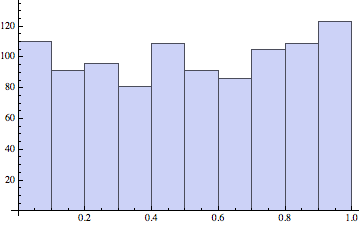
Finally, we can be reasonably comfortable with the following histogram.
Histogram[orbit, 10]

-
$\begingroup$ Nice! One way to prevent expression becoming crazy large using exact numbers for simple expressions like this is to
Simplifyalong the way:Block[{$MaxExtraPrecision=500},Nest[Simplify[f[#]] &, 1/GoldenRatio, 1000]]Time to compute went up from ~7ms to ~60ms, so still very quick $\endgroup$– sschCommented Feb 16, 2013 at 20:51 -
$\begingroup$ @ssch In this case, that's true. For other maps, the expression swell may be worse. $\endgroup$ Commented Feb 16, 2013 at 20:53

dyadic[x_, n_] := NestList[Mod[2 #, 1] &, x, n]$\endgroup$dyadicis the natural translation of the Bernoulli shift on two symbols to the unit interval, yes. $\endgroup$