0
$\begingroup$

I'm trying to specify yaxis tick labels from 0 to 1.0 in steps of 0.1. This is what I get:

ygrids=Range[0,1.0,0.1];
0.,0.1,0.2,0.30000000000000004,0.4,0.5,0.6000000000000001,0.7000000000000001,0.8,0.9,1.}

Round[ygrids,0.01] doesn't fix it. (0.001 fixes all but the 7.0000x)

This is too simple to be this hard!

Help appreciated (version 10.1)

$\endgroup$
7
  • $\begingroup$ Round[ygrids, 1/10] // N, Range[0, 1, 1/10] // N,N@Rationalize@Range[0, 1.0, 0.1]... $\endgroup$
    – ciao
    Commented Aug 12, 2015 at 0:56
  • $\begingroup$ You can format inline code and code blocks by selecting the code and clicking the {} button above the edit window. The edit window help button ? is also useful for learning how to format your questions and answers. You may also find this this meta Q&A helpful $\endgroup$
    – Michael E2
    Commented Aug 12, 2015 at 1:02
  • $\begingroup$ This needs to be marked as a duplicate, not closed as a "simple mistake." $\endgroup$
    – Mr.Wizard
    Commented Aug 12, 2015 at 2:08
  • 1
    $\begingroup$ A few links: (2915), (5580), (14122), (14511), (39126), (65298), (75528), (78298) $\endgroup$
    – Mr.Wizard
    Commented Aug 12, 2015 at 2:12
  • $\begingroup$ @Mr.Wizard: a duplicate of a simple mistake? ;-) $\endgroup$
    – ciao
    Commented Aug 12, 2015 at 2:31

1 Answer 1

1
$\begingroup$

I think you should cut the Gordian Knot and forget about rounding.

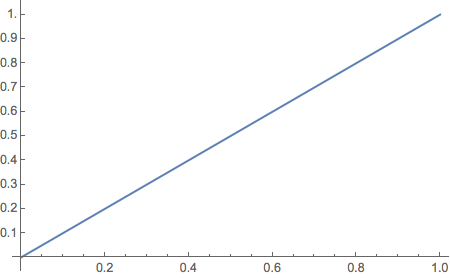
Plot[x, {x, 0, 1}, Ticks -> {Automatic, Range[0., 1., .1]}]

plot

The lack of rounding has no visible affect on the plot.

$\endgroup$
1
  • $\begingroup$ Yes, I will give this a try next time as I like the simplicity. I hope it works on more complicated graph axis ticks as well. $\endgroup$ Commented Aug 12, 2015 at 16:27

Not the answer you're looking for? Browse other questions tagged or ask your own question.