16
$\begingroup$

How can I have a conditional format of the values appearing in the axis of a plot ?

I have in mind the number format options available in Excel for plots as described here http://peltiertech.com/Excel/NumberFormats.html.

I'm mostly interested in how to format numbers as shown in the paragraph "Thousands, Millions, etc." in order to display 100 000 as 100k and 100 000 000 as 100M for example.

Also is it possible to set this format by default in plots ?

$\endgroup$
2
  • $\begingroup$ This can be done, with a bit of effort/code, by writing a function f to generate the appropriate ticks specification, and then use Ticks -> {Automatic, f}. But you'll have to determine tick placement, size, etc... on your own (FindDivisions is useful here.) $\endgroup$ Commented Mar 24, 2012 at 15:26
  • 2
    $\begingroup$ See my answer here. That gives a general way to format the ticks as you want — you just need to replace the xTicks function with your own logic to convert 10^8 as 100 M, etc. $\endgroup$
    – rm -rf
    Commented Mar 24, 2012 at 15:37

3 Answers 3

15
$\begingroup$

One can also define a KMB number format using NumberForm and its options as follows:

 g[a_] := Switch[a, "3", "K", "6", "M", "9", "B", "12", "T", _, ""]; 
 kmbtForm[num_?NumericQ, digits_?IntegerQ] := 
 StringReplace[#, "." ~~ x : ("K" | "M" | "B" | "T") -> x] &@
 ToString@
 NumberForm[N@#1, #2, 
  ExponentFunction -> (If[0 >= #, 0, 3 Quotient[#, 3]] &), 
  NumberFormat -> (StringJoin[#1, g[#3]] &)] & @@ {num, digits}

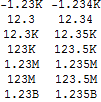
Usage examples:

  {kmbtForm[#, 3], kmbtForm[#, 4]} & 
   /@ {-1234, 12.34, 12345.67, 123456.7, 1234567., 123456789.123, 1234567891.} // Grid

gives

enter image description here

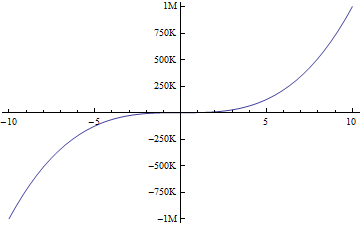
For plot ticks, using a variation of Faysal's tick function with this formatting function

 tickfunc[xmin_, xmax_] := 
 Function[tickNumber, {tickNumber, kmbtForm[tickNumber, 3]}] /@ 
 FindDivisions[{xmin, xmax}, 10];

in

 Plot[1000 x^3, {x, -10, 10}, Ticks -> {Automatic, tickfunc}]

gives

enter image description here

$\endgroup$
3
  • $\begingroup$ This looks quite flexible. +1 $\endgroup$
    – Mr.Wizard
    Commented Mar 27, 2012 at 5:24
  • $\begingroup$ Indeed, +1 and accept. $\endgroup$
    – faysou
    Commented Mar 27, 2012 at 7:12
  • $\begingroup$ @Mr.Wizard and Faysal, Thank you for the vote and accept. $\endgroup$
    – kglr
    Commented Mar 27, 2012 at 17:57
9
$\begingroup$

Here's what I've come up with based on the comment of Brett and the example of Chris that suits what I wanted.

tickNumberFormat[xmin_,xmax_]:=
Function[tickNumber,
    {
        tickNumber
        ,
        Which[
            Abs@tickNumber>=10^9,
                StringReplace[ToString[tickNumber/10.^9]~~"bn",".bn"->"bn"],

            Abs@tickNumber>=10^6,
                StringReplace[ToString[tickNumber/10.^6]~~"m",".m"->"m"],

            Abs@tickNumber>=10^3,
                StringReplace[ToString[tickNumber/10.^3]~~"k",".k"->"k"],

            True,
                tickNumber
        ]
    }
]/@FindDivisions[{xmin,xmax},10];

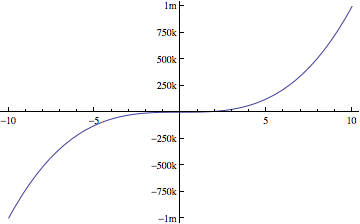
SetOptions[Plot, Ticks -> {Automatic, tickNumberFormat}];

Plot[1000 x^3,{x,-10,10}] 

enter image description here

$\endgroup$
7
$\begingroup$

As Brett mentions, for example:

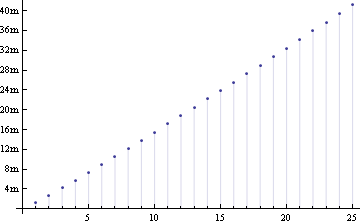
yticks = {#*10^6, ToString[#] <> "m"} & /@ (Range[10]*4);
ListPlot[Prime[Range[25]*10^5], Filling -> Axis, Ticks -> {Automatic, yticks}]

enter image description here

$\endgroup$

Your Answer

By clicking “Post Your Answer”, you agree to our terms of service and acknowledge you have read our privacy policy.

Not the answer you're looking for? Browse other questions tagged or ask your own question.