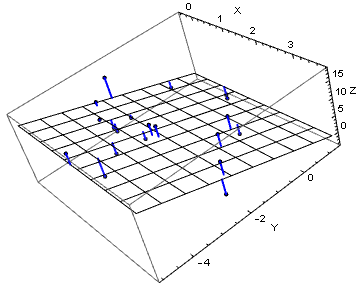
A work-around: add the vertical lines using `Graohics3D`:
Show[ListPointPlot3D[{xyzData, predictedZ}, PlotRange -> All,
PlotStyle -> {Directive[Black, PointSize[Medium]],
Directive[Red, PointSize[Small]]}],
Plot3D[model[x, y], {x, xMin, xMax}, {y, yMin, yMax},
PlotStyle -> Directive[Opacity[0.1], Specularity[], Glow[White]],
Mesh -> 8, ViewVertical -> {0, 0, 1}],
Graphics3D[{Blue, Thick, Line /@ Transpose[{xyzData, predictedZ}]}],
PlotRange -> All, AxesLabel -> {"X", "Y", "Z"},
LabelStyle -> Directive[FontFamily -> "Helvetica"]]
