**Update 2:** Based on the accepted answer it now seems that removing the bottom of edge of rectangles is not essential. In that case, the option `ChartBaseStyle` gives the desired result (there is no need for custom `ChartElementFunction`s):
Histogram[data, ChartBaseStyle -> EdgeForm[Thickness[.01]]]
[![enter image description here][1]][1]
Histogram[data, ChartStyle -> "Pastel",
ChartElementFunction -> "GlassRectangle",
ChartBaseStyle -> EdgeForm[{Opacity[1, Red], Thickness[.01]}]]
[![enter image description here][2]][2]
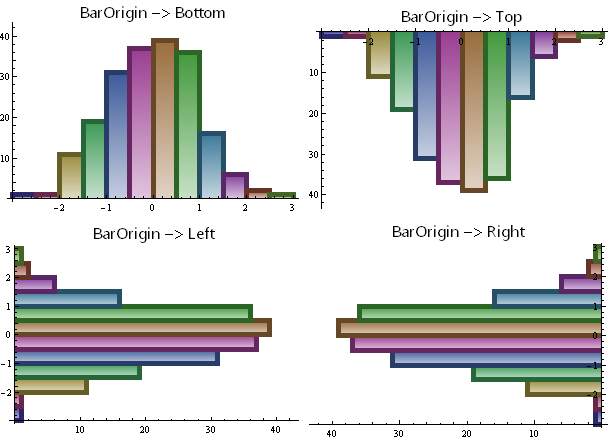
**Update:** The `ChartElementFunction` in the original post works only for the default setting for the option `BarOrigin`. The new function `ceF2` works for arbitrary values for the `BarOrigin` option.
ceF2[cedf_: "GlassRectangle", o : OptionsPattern[]][col_: Black, thickness_: 3] :=
Module[{or = Charting`ChartStyleInformation["BarOrigin"], ll = Tuples[#][[{1, 2, 4, 3}]]},
ll = RotateRight[ll, Switch[or, Bottom, 0, Top, 2, Left, 3, Right, 1]] ;
{ChartElementDataFunction[cedf, o][##],
col, AbsoluteThickness[thickness], CapForm["Butt"], Line[ll]}] &
Examples:
Grid[Partition[Histogram[data, ChartStyle -> 1, ImageSize -> 300,
PlotLabel -> Style["BarOrigin -> " <> ToString[#], 16, "Panel"],
ChartElementFunction -> ceF2["FadingRectangle", "GradientOrigin" -> Top][
Dynamic[Darker@CurrentValue["Color"]], 5],
BarOrigin -> #] & /@ {Bottom, Top, Left, Right}, 2]]
**Original post:**
A more flexible chart element function that modifies built-in chart element functions to add thick lines:
ClearAll[ceF]
ceF[cedf_: "GlassRectangle", o : OptionsPattern[]][col_: Black, thickness_: 3] :=
{ChartElementDataFunction[cedf, o][##],
col, AbsoluteThickness[thickness], CapForm["Butt"],
Line[Tuples[#][[{1, 2, 4, 3}]]]} &
Examples:
SeedRandom[42];
data = RandomVariate[NormalDistribution[0, 1], 200];
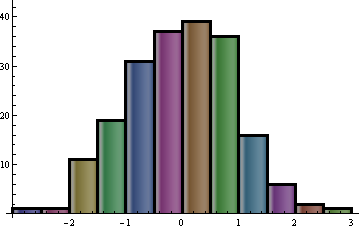
Histogram[data, ChartStyle -> 1, ChartElementFunction -> ceF[][]]
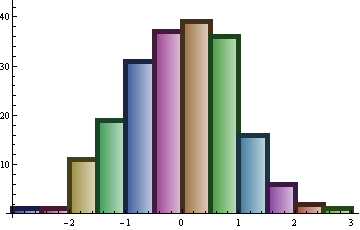
Histogram[data, ChartStyle -> 1,
ChartElementFunction ->
ceF["FadingRectangle"][Dynamic[Darker@Darker@CurrentValue["Color"]], 5]]
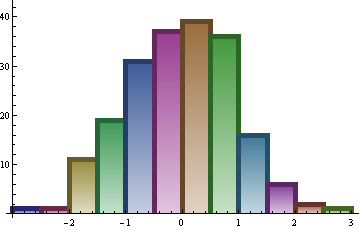
Histogram[data, ChartStyle -> 1,
ChartElementFunction ->
ceF["FadingRectangle", "GradientOrigin"->Top][Dynamic[Darker@CurrentValue["Color"]], 5]]
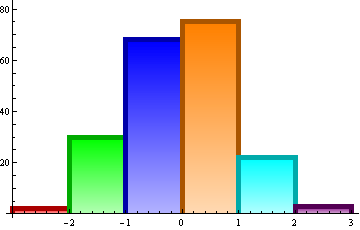
Histogram[data, 5, ChartStyle -> {Red, Green, Blue, Orange, Cyan, Purple},
ChartElementFunction ->
ceF["FadingRectangle", "GradientOrigin"->Top][Dynamic[Darker@CurrentValue["Color"]], 5]]
[1]: https://i.sstatic.net/uOu7g.png
[2]: https://i.sstatic.net/LYxWF.png