I'm sure I've seen this sort of thing done before, but now I can't find a working implementation anywhere.
Below I give a toy example that is just complex enough to illustrate the issues. **(I provide full code after the problem's description.)**
---
First, consider this simple (and entirely meaningless) barchart:
In[122]:= With[
{
labels = BlockRandom[SeedRandom[-2];
RandomSample[DictionaryLookup[{"English", ___}], nItems]
]
},
Framed[
BarChart[data, ChartLabels -> labels
, ChartStyle -> LightGray
, BarOrigin -> Left
, ImageSize -> 250
]
, FrameStyle -> Thin
]
]
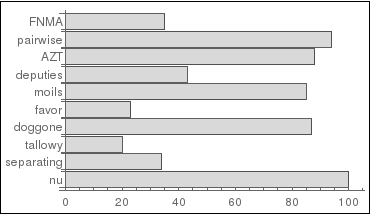
> The goal is to replace the text labels along the left with `Graphic` objects, ("graphic labels", if you will), in such a way that these labels *scale appropriately with the figure*.
---
For this (rather artificial!) example, the "graphic labels" I have in mind consist of several colored `Rectangle` objects lined up in a row, like this:

(The black dot just marks the point (0, 0) in the barcode's internal reference frame; it is not part of the barcode.)
I defined a `barcode` function that, for any integer argument, generates a (random-but-reproducible) "barcode" like the one above.
Now, if I substitute such graphic labels for the text ones in the barchart, this is what I get:
In[124]:= With[
{
labels = Table[Graphics[barcode[i]], {i, Length[data]}]
},
Framed[
BarChart[data, ChartLabels -> labels
, ChartStyle -> LightGray
, BarOrigin -> Left
, ImageSize -> 250
]
, FrameStyle -> Thin
]
]
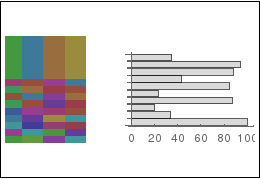
Not great. For one thing, the barcodes come out too big, and too far from the vertical axis.
But most seriously, the size of the barcodes does not change when `ImageSize` changes. For example, if `ImageSize` is changed from 250 to 500, the result looks like this:
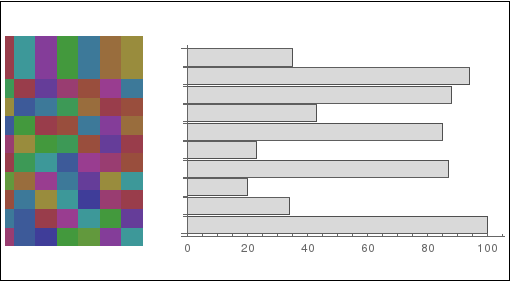
Confusingly enough, even though the size of the barcodes remains constant, the spacing *between* them changes in proportion to the change in `ImageSize`.
---
I'm looking for a way to set the size of the barcodes so that
1. the height of the barcode corresponds to 1 plot unit (or slightly less), *while preserving the barcode's original aspect ratio*;
2. the spacing between the barcodes and the (vertical) axis matches that between text labels and the axis;
3. both the size of the barcode and the spacing between one barcode and the next one, and between the barcodes and axis *scale with the image*.
With enough trial-and-error, I can find a "solution" that meets requirements (1) and (2), but I have not been able to find one that *also* meets requirement (3).
The next section includes all the code referenced above; the last section documents some failed attempts at solving the problem.
---
Code
---
nItems = 10;
data = BlockRandom[SeedRandom[-1];
20 + RandomInteger[80, nItems]
];
With[{
labels = BlockRandom[SeedRandom[-2];
RandomSample[DictionaryLookup[{"English", ___}], nItems]
]
},
Framed[
BarChart[data, ChartLabels -> labels
, ChartStyle -> LightGray
, BarOrigin -> Left
, ImageSize -> 250
]
, FrameStyle -> Thin
]
]
palette = ColorData[1, "ColorList"];
basewidth = 0.5;
baseheight = 1;
nstrips = 8;
baserect = Rectangle[{0, 0}, {basewidth, baseheight}];
barcode[index_] := BlockRandom[
SeedRandom[index];
Module[{colors = RandomSample[palette, nstrips]},
Table[Translate[{colors[[i]],
baserect}, {(i - nstrips - 1) basewidth, -0.5 baseheight}], {i,
nstrips}]
]
]
Graphics[{barcode[1], Disk[{0, 0}, 0.05]}, Frame -> True, ImageSize -> Medium]
With[{
labels = Table[Graphics[barcode[i]], {i, Length[data]}]
},
Framed[
BarChart[data, ChartLabels -> labels
, ChartStyle -> LightGray
, BarOrigin -> Left
, ImageSize -> 250
]
, FrameStyle -> Thin
]
]
With[{
labels = Table[Graphics[barcode[i]], {i, Length[data]}]
},
Framed[
BarChart[data, ChartLabels -> labels
, ChartStyle -> LightGray
, BarOrigin -> Left
, ImageSize -> 500
]
, FrameStyle -> Thin
]
]
---
Failures
---
**Using `Scaled`**
Block[{baserect =
Rectangle[Scaled[{0, 0}], Scaled[{basewidth, baseheight}]]},
With[{
labels = Table[Graphics[barcode[i]], {i, Length[data]}]
},
Framed[
BarChart[data, ChartLabels -> labels
, ChartStyle -> LightGray
, BarOrigin -> Left
, ImageSize -> 250
]
, FrameStyle -> Thin
]
]
]
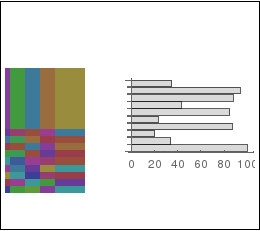
- swatches within barcode overlap
- overall scaling is wrong
- positioning is wrong
**Drawing labels in plot-space**
With[{
labels =
Table[Graphics[Translate[barcode[i], {0, i}]], {i, Length[data]}]
},
Framed[
Show[{
BarChart[data, ChartLabels -> None
, ChartStyle -> LightGray
, BarOrigin -> Left
, ImageSize -> 250
],
labels
}
]
, FrameStyle -> Thin
]
]
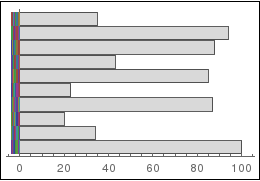
- aspect ratio is wrong
**Using `Inset`**
With[{
labels =
Graphics[Table[Translate[barcode[i], {0, i}], {i, Length[data]}]]
},
Framed[
BarChart[data, ChartLabels -> None
, ChartStyle -> LightGray
, BarOrigin -> Left
, ImageSize -> 250
, ImagePadding -> {{50, Automatic}, {120, Automatic}}
, Epilog -> Inset[labels, {0, 0}]
]
, FrameStyle -> Thin
]
]
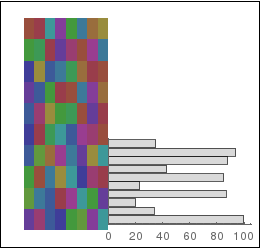
- overall scaling is wrong