(too long for a comment)
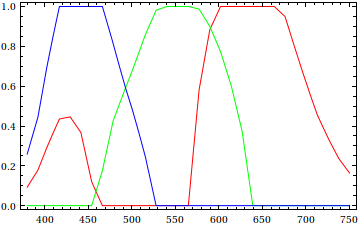
Plot[{ColorData["VisibleSpectrum"][x][[1]],
ColorData["VisibleSpectrum"][x][[2]],
ColorData["VisibleSpectrum"][x][[3]]}, {x, 380, 750}, PlotStyle -> {Red, Green, Blue}]

It doesn't seem that you'll be able to obtain `Yellow` (`RGBColor[1, 1, 0]`) from `ColorData["VisibleSpectrum"]`; unfortunately, the docs say nothing about how they're blending the colors to produce `"VisibleSpectrum"`.
---
**Addendum:**
Just to make this post less useless, here's a *Mathematica* implementation of [Bruton's conversion algorithm](http://www.physics.sfasu.edu/astro/color/spectra.html):
brutonIntensity = Interpolation[{{380, 3/10}, {420, 1}, {700, 1}, {780, 3/10}},
InterpolationOrder -> 1];
brutonLambda[x_, γ_: 4/5] := Map[N[brutonIntensity[x] #]^γ &,
Blend[{{0, Magenta}, {3/20, Blue}, {11/40, Cyan}, {13/40, Green}, {1/2, Yellow},
{53/80, Red}, {1, Red}}, Rescale[x, {380, 780}]]] /;
380 <= x <= 780 && 0 < γ <= 1
Here's a gradient plot:

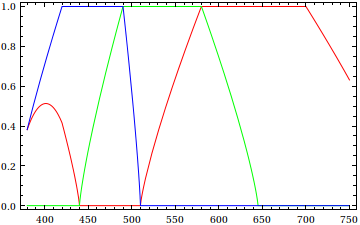
and an RGB component plot:

I haven't fully investigated the method for converting wavelengths to CIE xyz coordinates; maybe one of these days...