I think there are at least three elements to consider here:
1. `FourierTransform` and `Fourier`, by default, output results in different forms
2. Plotting `Sin[x] UnitStep[x]` is not the same as `Sin[x]` and behaves differently when used in conjunction with `Fourier` and `FourierTransform`
3. Plot does not handle `DiracDelta` elegantly
The signal processing form of the Fourier transform of a continuous sine wave is a single Dirac delta function located at the frequency of the sine wave.
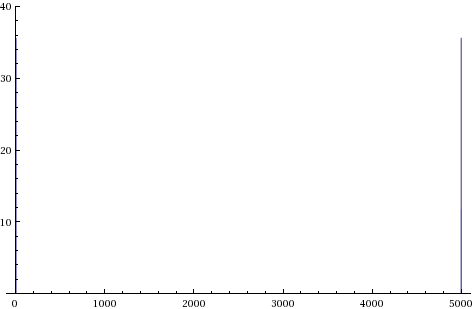
ListLinePlot[Abs[Fourier[Table[Sin[2 \[Pi] 1 t] , {t, 0, 5, 0.001}]]],
PlotRange -> {Automatic, {0, 40}}]

Note the symmetric spikes around list element 2500 in the above plot of a sine wave with frequency of unity.
`Fourier` produces a result which runs up from 0 to max freq and then down from max freq to 0, consisting of two identical spectra reflected around the centre of the list. In contrast, by default `FourierTransform` produces an expression which covers the range 0 up to max freq.
If you reduce the resolution of the time steps:
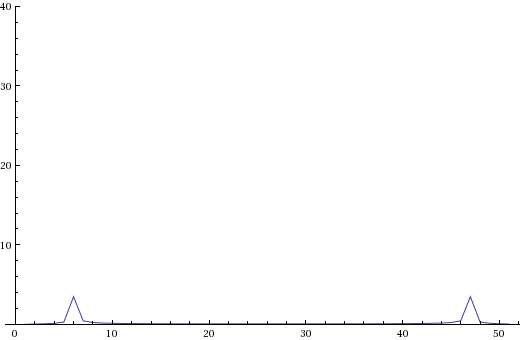
ListLinePlot[Abs[Fourier[Table[Sin[2 \[Pi] 1 t] , {t, 0, 5, 0.1}]]],
PlotRange -> {Automatic, {0, 40}}]

the Dirac delta appears smeared out across a range of frequencies, this is an effect of the discrete nature of this transform.
I suspect there is an issue in the continuous case when using `FourierTransform` in that `DiracDelta` does not resolve to a numeric value when plotting, so you don't see the spike in the continuous form of the plot.
The result you obtain with when using `Sin[x] UnitStep[x]` in the discrete case is equivalent to `Sin[x]` as `UnitStep[n]` evaluates to 1, so use of the `UnitStep` results in no modification to the `Sin` function.
In the continuous case, `Sin[x] UnitStep[x]` does not evaluate to `Sin[x]` but a truncated sine wave. Sharp discontinuities, such as those introduced by unit steps, cause a smearing in the frequency domain. I suspect this is the origin of your broad spectrum like plot for the continuous case as can be seen by examining the Fourier transforms of the two expressions.
FourierTransform[Sin[t], t, \[Omega]]
>$$i \sqrt{\frac{\pi }{2}} \text{DiracDelta}[-1+\omega ]-i \sqrt{\frac{\pi }{2}} \text{DiracDelta}[1+\omega ]$$
FourierTransform[Sin[t] UnitStep[t], t, \[Omega]]
>$$-\frac{1}{2 \sqrt{2 \pi } (-1+\omega )}+\frac{1}{2 \sqrt{2 \pi } (1+\omega )}+\frac{1}{2} i \sqrt{\frac{\pi }{2}} \text{DiracDelta}[-1+\omega ]-\frac{1}{2} i \sqrt{\frac{\pi }{2}} \text{DiracDelta}[1+\omega ]$$
Which has terms inversely proportional to omega giving the long tail in your `FourierTransform` plot.
One option might be to replace `DiracDelta` with its discrete counterpart `DiscreteDelta` which evaluates to 1 at its location.
Table[DiscreteDelta[n], {n, -2, 2}]
>{0, 0, 1, 0, 0}
FourierTransform[Sin[t], t, \[Omega]] /. DiracDelta -> DiscreteDelta
>$$i \sqrt{\frac{\pi }{2}} \text{DiscreteDelta}[-1+\omega ]-i \sqrt{\frac{\pi }{2}} \text{DiscreteDelta}[1+\omega ]$$