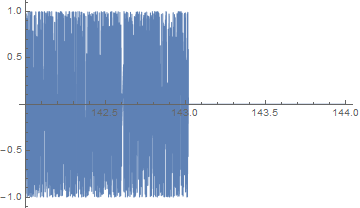
When plotting the graph of $sin(x^x)$ I noticed that there is no plot from about $x=143$. I don't suppose there is a purely mathematical explanation for this?
So, why is there no graph in mathematica from $x=143$? Some kind of overflow?
f[x_] = Sin[x^x]
Plot[{f[x]}, {x, 142, 144}, PlotStyle -> Thin, PlotLegends -> "Expressions"]
