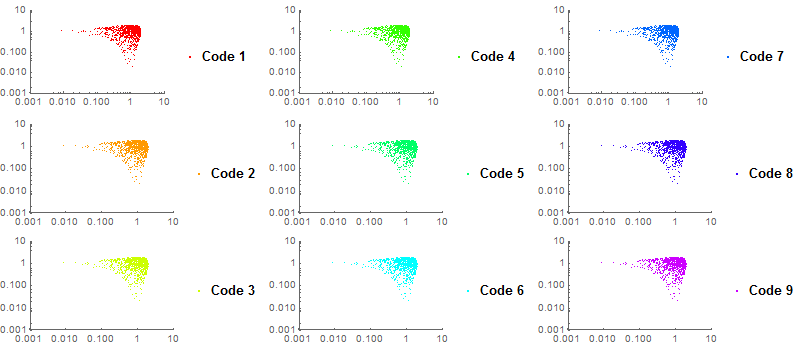
The answer by @corey979 is very good. Here I do basically the same, but with the following difference
- Used limited scope (Avoid global variables) with [`Module`][1]
- Use [`Hue`][2] and [`Rescale`][3] to define the colours programmatically in order.
- Use [`StringTemplate`][4] instead of [`StringJoin`][5]
Here is my take
Multicolumn[
Module[
{
niterations = 9,
data = RandomPoint[Disk[{1,1}], 1000]
},
Table[
ListLogLogPlot[
data
, PlotStyle -> Hue[0.8 Rescale[k, {1, niterations}]]
, PlotLegends -> {StringTemplate["Code ``"][k]}
, PlotRange -> {{10^-3, 10}, {10^-3, 10}}
]
, {k, niterations}
]]]

[1]: https://reference.wolfram.com/language/ref/Module.html
[2]: https://reference.wolfram.com/language/ref/Hue.html
[3]: https://reference.wolfram.com/language/ref/Rescale.html
[4]: https://reference.wolfram.com/language/ref/StringTemplate.html
[5]: https://reference.wolfram.com/language/ref/StringJoin.html