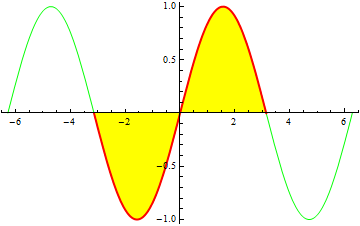
An alternative is to use Piecewise as follows
Plot[{Sin[x], Piecewise[{{Sin[x], -Pi <= x <= Pi}}, _]}, {x, -2 Pi, 2 Pi},
  Filling -> {2 -> {Axis, Yellow}}, PlotStyle -> {Green, Directive[Red, Thick]}]
which gives

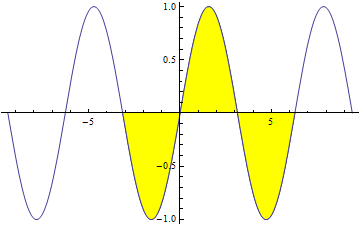
Or use Show to superimpose two variants (the second one with your choice of the variable bounds -- -Pi and 2Pi inn the example below) of the plot:
Show[Plot[Sin[x], {x, -3 Pi, 3 Pi}],
     Plot[Sin[x], {x, - Pi, 2 Pi},
         Filling -> Axis, FillingStyle -> Yellow]]

