The Fourier transform of a continuous sine wave is a single Dirac delta function located at the frequency of the sine wave and reflected around zero frequency into the positive and negative frequency spaces.
ListLinePlot[Abs[Fourier[Table[Sin[2 \[Pi] 1 t] , {t, 0, 5, 0.001}]]],
PlotRange -> {Automatic, {0, 40}}]

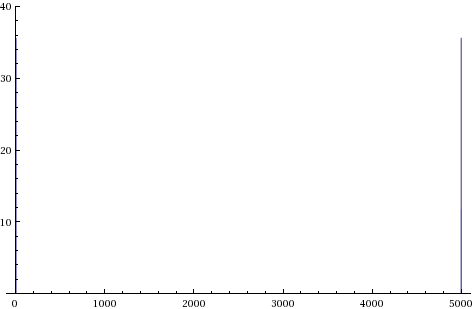
Note the symmetric spikes around list element 2500 in the above plot of a sine wave with frequency of unity.
If you reduce the resolution of the time steps:
ListLinePlot[Abs[Fourier[Table[Sin[2 \[Pi] 1 t] , {t, 0, 5, 0.1}]]],
PlotRange -> {Automatic, {0, 40}}]

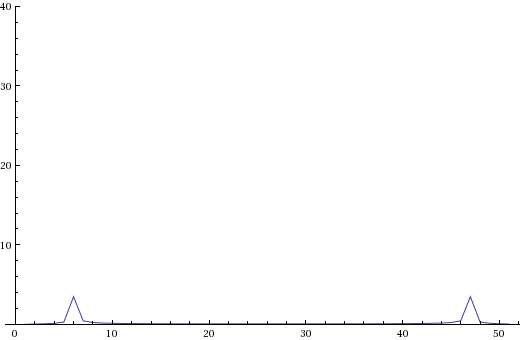
the Dirac delta appears smeared out across a range of frequencies, this is an effect of the discrete nature of this transform.
I suspect there is an issue in the continuous case when using `FourierTransform` in that `DiracDelta` does not resolve to a numeric value when plotting, so you don't see the spike in the continuous form of the plot.
The result you obtain with when using `Sin[x] UnitStep[x]` in the discrete case is equivalent to `Sin[x]` as `UnitStep[n]` evaluates to 1, so use of the `UnitStep` results in no modification to the `Sin` function.
In the continuous case, `Sin[x] UnitStep[x]` does not evaluate to `Sin[x]` but a truncated sine wave. Sharp discontinuities, such as those introduced by unit steps, cause a smearing in the frequency domain. I suspect this is the origin of your broad spectrum like plot for the continuous case as can be seen by examining the Fourier transforms of the two expressions.
FourierTransform[Sin[t], t, \[Omega]]
>I Sqrt[\[Pi]/2] DiracDelta[-1 + \[Omega]] -
I Sqrt[\[Pi]/2] DiracDelta[1 + \[Omega]]
FourierTransform[Sin[t] UnitStep[t], t, \[Omega]]
>-(1/(2 Sqrt[2 \[Pi]] (-1 + \[Omega]))) + 1/(
2 Sqrt[2 \[Pi]] (1 + \[Omega])) +
1/2 I Sqrt[\[Pi]/2] DiracDelta[-1 + \[Omega]] -
1/2 I Sqrt[\[Pi]/2] DiracDelta[1 + \[Omega]]