DendogramPlot accepts Axes as an option.
Inter-cluster distances in a Cluster object are given as the third from last element.

In the following, these distances are highlighted in red:
 Grid[{{Agglomerate[{1, 2, 10, 4, 8},
 DistanceFunction -> Automatic,
 Linkage -> "Single"]},
 {DendrogramPlot[{1, 2, 10, 4, 8},
 DistanceFunction -> Automatic, Linkage -> "Single",
 LeafLabels -> (# &), ImageSize -> 300, Axes -> {False, True},
 AxesOrigin -> {0, Automatic}]}}]

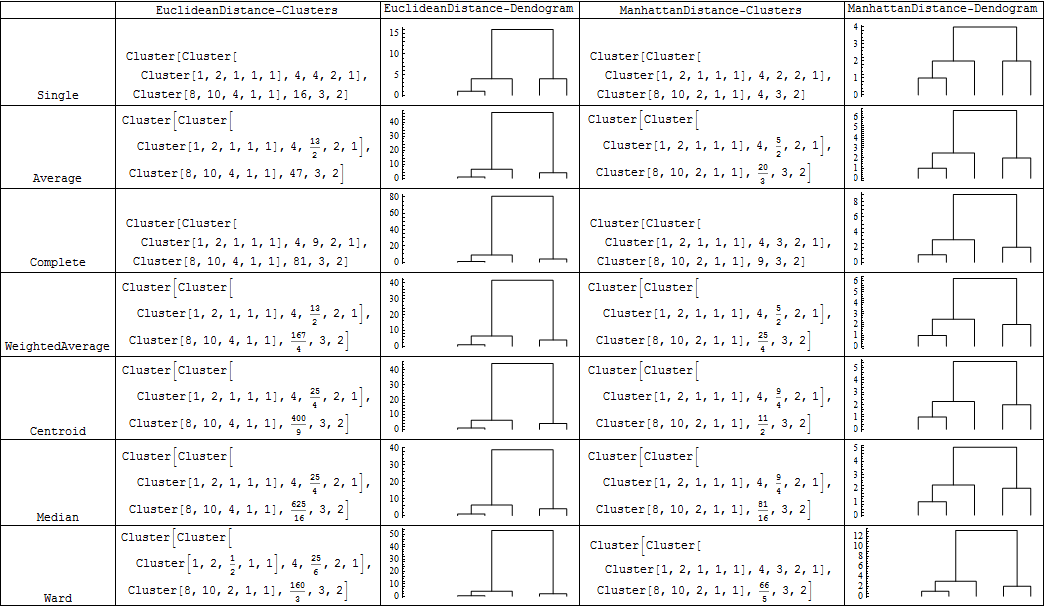
So ... this verifies that vertical axis does indeed measure the inter-cluster distances for a given DistanceFunction and Linkage.
For various combinations of DistanceFunction and Linkage you get the following pictures:
{#, Agglomerate[{1, 2, 10, 4, 8}, DistanceFunction -> Automatic, Linkage -> #],
 DendrogramPlot[{1, 2, 10, 4, 8},
 DistanceFunction -> Automatic, Linkage -> #,
 Axes -> {False, True}, AxesOrigin -> {-1, Automatic}],
 Agglomerate[{1, 2, 10, 4, 8}, DistanceFunction -> ManhattanDistance, Linkage -> #],
 DendrogramPlot[{1, 2, 10, 4, 8},
 DistanceFunction -> ManhattanDistance, Linkage -> #,
 Axes -> {False, True}, AxesOrigin -> {-1, Automatic}]} & /@
 {"Single", "Average","Complete", "WeightedAverage", "Centroid", "Median","Ward"} //
 Grid[Prepend[#, {"", "EuclideanDistance-Clusters",
 "EuclideanDistance-Dendogram", "ManhattanDistance-Clusters",
 "ManhattanDistance-Dendogram"}],
  Dividers -> All, Alignment -> Bottom] &

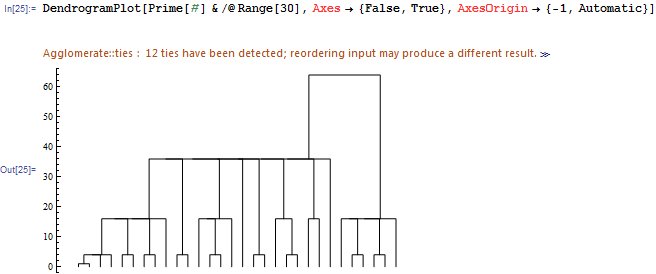
EDIT: Note: Despite syntax highlighting in red of Axes and AxesOrigin, the options seem to work:
DendrogramPlot[Prime[#] & /@ Range[30], Axes -> {False, True},
AxesOrigin -> {-1, Automatic}]

