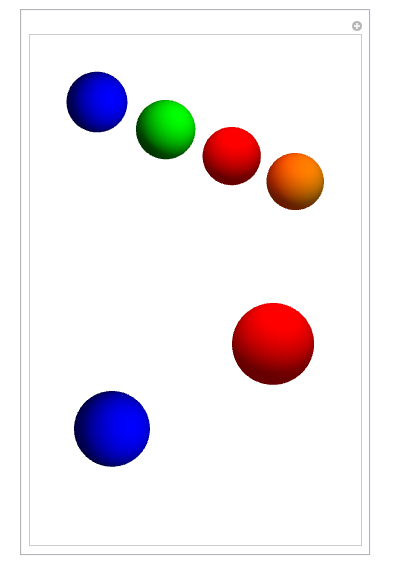
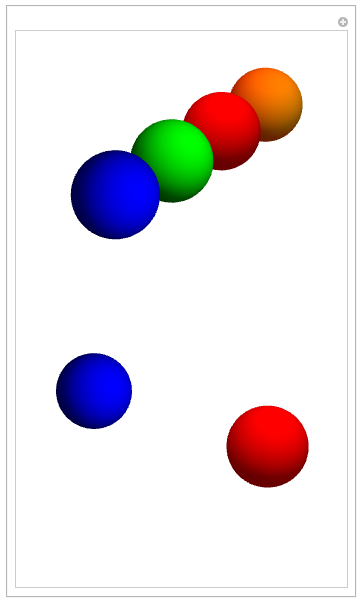
What I'm trying to do is to create a series of Graphics3D objects and let them control the display of corresponding Graphics3D objects in a different Pane and maintain the Graphics3D feature at the same time.
My first try was simple. I initialized an empty list to store the objects I want to display. When I click the certain sphere in the picture, it will append itself to the display list if there's no duplication in the list. If I click it again, it will remove itself from display list so that itself will hide from the pane.


As what the sample picture shows, four spheres are still kept in one Graphics3D field, you can still rotate or move the spheres. When I click the blue sphere and red sphere, the new sphere will display at the corresponding location.
Therefore, I tried to implement the feature as the code below:
Manipulate[
 With[{Solar = {Graphics3D[{Blue,
       Sphere[{0.5*Cos[0], 0.5*Sin[0], 0}, 0.2]}, Boxed -> False],
     Graphics3D[{Green, Sphere[{1*Cos[0], 1*Sin[0], 0}, 0.2]},
      Boxed -> False],
     Graphics3D[{Red, Sphere[{1.5*Cos[0], 1.5*Sin[0], 0}, 0.2]},
      Boxed -> False],
     Graphics3D[{Orange, Sphere[{2*Cos[0], 2*Sin[0], 0}, 0.2]},
      Boxed -> False]}},
   Column[{
     Graphics3D[{
       Map[If[FreeQ[u, #[[1]]],
          Button[#[[1]], AppendTo[u, #[[1]]]],
          Button[#[[1]], u = DeleteCases[u, #[[1]]]]] &, Solar]},
      ImageSize -> 300, Boxed -> False],
     Row[{Pane[Graphics3D[{#}, Boxed -> False], {300, 300},
          Alignment -> {Center, Center}]}] &[Union@u]}]],
 {{u, {}}, ControlType -> None}, SaveDefinitions -> True]
Then I tried further implementation:
Manipulate[
 With[{Models = {{
      Graphics3D[{Blue, Sphere[{0.5*Cos[0], 0.5*Sin[0], 0}, 0.2]},
       Boxed -> False],
      SphericalPlot3D[
       1 + 2 Cos[2 \[Theta]], {\[Theta], 0, \[Pi]}, {\[Phi], 0,
        2 \[Pi]}, PlotStyle -> Blue, Mesh -> None, Boxed -> False,
       Axes -> False]
      },
     {
      Graphics3D[{Red, Sphere[{1*Cos[0], 1*Sin[0], 0}, 0.2]},
       Boxed -> False],
      SphericalPlot3D[
       Evaluate@
        Abs@SphericalHarmonicY[3, 1, \[Theta], \[Phi]], {\[Theta],
        0, \[Pi]}, {\[Phi], 0, 2 \[Pi]}, PlotStyle -> Red,
       Mesh -> None, Boxed -> False, Axes -> False]
      },
     {
      Graphics3D[{Green, Sphere[{1.5*Cos[0], 1.5*Sin[0], 0}, 0.2]},
       Boxed -> False],
      ParametricPlot3D[{Cos[
          u] (3 + Cos[u/2] Sin[v] - Sin[u/2] Sin[2 v]),
        Sin[u] (3 + Cos[u/2] Sin[v] - Sin[u/2] Sin[2 v]),
        Sin[u/2] Sin[v] + Cos[u/2] Sin[2 v]}, {u, 0, 2 Pi}, {v, 0,
        2 Pi}, PlotStyle -> FaceForm[Green, Green], Mesh -> None,
       Boxed -> False, Axes -> False]
      },
     {
      Graphics3D[{Orange, Sphere[{2*Cos[0], 2*Sin[0], 0}, 0.2]},
       Boxed -> False],
      RevolutionPlot3D[{2 + Cos[t], Sin[t]}, {t, 0, 2 Pi},
       PlotStyle -> Orange, Mesh -> None, Boxed -> False,
       Axes -> False]
      }}},
  Column[{
    Graphics3D[{
      If[FreeQ[u, #[[2]]],
         Button[#[[1]], AppendTo[u, #[[2]]]],
         Button[#[[1]], u = DeleteCases[u, #[[2]]]]] & /@
       Models}, ImageSize -> 300, Boxed -> False],
    Row[{Pane[Graphics3D[{#}, Boxed -> False], {300, 300},
         Alignment -> {Center, Center}]}] &[Union@u]}]], {{u, {}},
  ControlType -> None}, SaveDefinitions -> True]
Next I tried to display the different corresponding objects, so I set up a Models list to store the corresponding pairs. Therefore, when I click a sphere, it will append/delete the corresponding objects. However, I keep getting the error:
"Graphics is not a Graphics3D directive."
I'm confused because neither of the objects are Graphics type. I'm guessing there is some conflict between the objects pairs when I append those sphere buttons.
###Edit
( by m_goldberg)
Here is the OP's code redacted to something much closer to a minimal working example. I hope it will make the OP's problem more accessible to other Mathematica.SE participants.
Manipulate[
  Column[{
    Graphics3D[
      Map[
        If[FreeQ[u, #[[1]]],
          Button[#[[1]], AppendTo[u, #[[1]]]],
          Button[#[[1]], u = DeleteCases[u, #[[1]]]]] &,
        Solar],
      ImageSize -> 300, Boxed -> False],
    Pane[Graphics3D[u, Boxed -> False], {300, 300}]}],
  {{u, {}}, ControlType -> None},
  Initialization :> (
    Solar =
      {Graphics3D[{Blue, Sphere[{0.5, 0., 0.}, 0.2]}, Boxed -> False],
       Graphics3D[{Green, Sphere[{1., 0., 0.}, 0.2]}, Boxed -> False],
       Graphics3D[{Red, Sphere[{1.5, 0., 0.}, 0.2]}, Boxed -> False],
       Graphics3D[{Orange, Sphere[{2., 0., 0.}, 0.2]}, Boxed -> False]}),
  SaveDefinitions -> True]
