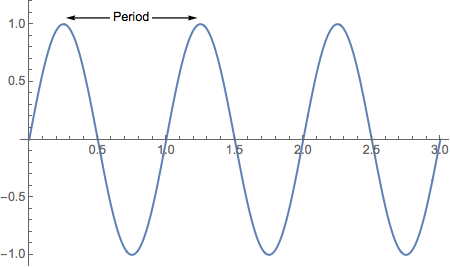
Plot[Sin[2 Pi x], {x, 0, 3},
  PlotRange -> All,
  PlotRangePadding -> {Automatic, {Automatic, .2}},
  Epilog ->
    Inset[Graphics[{
      Arrowheads[{-0.07, 0.07}],
      Arrow[{{.25, 0}, {1.25, 0}}],
      Text[Style[" Period ", Background -> White], {.75, 0}]}],
    {.75, 1.05}]]

