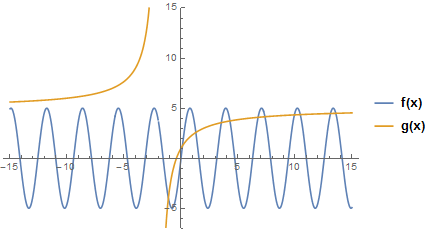
Your function f[x] is bounded to the interval $[-5, 5]$. On the other hand, $g[x] > 5$ for $x < -2$, so they never intersect there.
For $x>-2$, your functions intersect at infinitely many points. You can convince yourself of this by plotting them together using your definition:
Plot[
  {Legended[f[x], "f(x)"], Legended[g[x], "g(x)"]},
  {x, -2, 20}, Exclusions -> {x == -2},
  PlotRange -> {-7, 6}
]

Finding a closed form representing them all may be a major undertaking, if one exists at all.
On the other hand, numerical solutions can be obtained for any one of these intersections with a variety of techniques. For instance, the following finds the solution closest to 5:
FindRoot[f[x] == g[x], {x, 5}]

(* {x -> 4.2916} *)
More generally, you can find an arbitrary number of x values for which your equation holds using the FindInstance function:
FindInstance[f[x] == g[x], x, Reals, 10] // N

(*{
{x->69.7947},{x->500.259},{x->528.612},
{x->296.147},{x->299.185},{x->233.205},
{x->261.482},{x->443.708},{x->318.036},
{x->239.604}
}
*)
