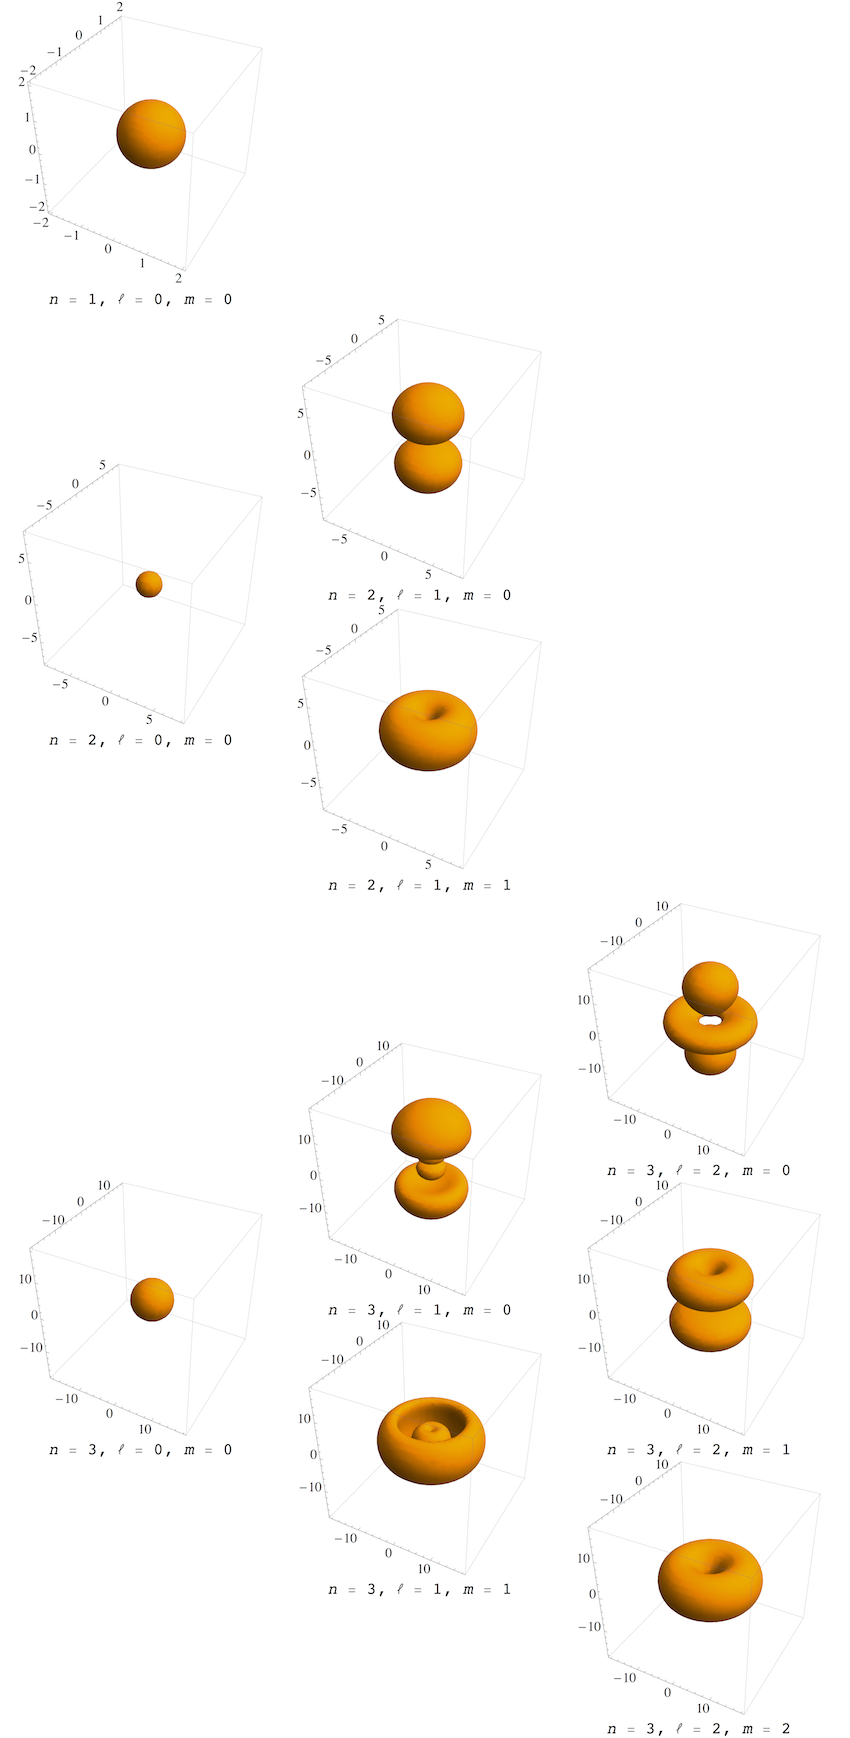
I recently revisited this, and found that RegionPlot3D is by far the fastest way to plot orbitals, compared to Image3D and ContourPlot3D. I was surprised by the difference, so I thought it's worth posting this.
In addition, I also made the process of choosing the plot parameters automatic, based on simple estimates for the size of the orbital wave function. So you don't have to find the right contour value by trial and error. This automation allows me to plot large numbers of orbitals in one go.
Below, I'm plotting the first ten orbitals in a systematic table, and the whole table takes about as long as doing one or two such plots using ContourPlot3D (depending on what functions I try). There was also no need to compile any of the functions, making the code quite straightforward.
Clear[rMin, rMax, r, θ, ϕ];
{rMin[n_, l_], rMax[n_, l_]} =
  r /. Simplify[
    Solve[(l (l + 1))/r^2 - 2/r == -(1/n^2), r],
    n > 0];

sphericalToCartesian =
  Thread[{r, θ, ϕ} -> {Sqrt[x^2 + y^2 + z^2],
     ArcCos[z/Sqrt[x^2 + y^2 + z^2]], Arg[x + I y]}];

ψ[n_, l_, m_][r_, θ_, ϕ_] :=
 Sqrt[ (n - l - 1)!/(n + l)!] E^(-(r/n)) ((2 r)/n)^l 2/
  n^2 LaguerreL[n - l - 1, 2 l + 1, (2 r)/n] SphericalHarmonicY[l,
   m, θ, ϕ]

ClearAll[plotOrbital];
plotOrbital[f_, range_, contour_, opt : OptionsPattern[]] :=
 RegionPlot3D[
  Evaluate[Abs[f[r, \[Theta], \[Phi]] /. sphericalToCartesian]^2 >
    contour], {x, -range, range}, {y, -range, range}, {z, -range,
   range}, opt, Mesh -> False, PlotPoints -> 35, PlotStyle -> Orange,
  Lighting -> "Neutral"]

grid = Table[
   Labeled[plotOrbital[ψ[n, l, m], 2 n^2, .05/n^6],
    Row[{"n = ", n, ", ℓ = ", l, ", m = ", m}]], {n, 1,
    3}, {l, 0, n - 1}, {m, 0, l}];

TableForm[grid]

Above, the complete hydrogenic orbital wave function is ψ.
Given the principal quantum number n, the energy is known. Setting the energy equal to the effective potential yields the classical turning points, {rMin[n_, ℓ_], rMax[n_, ℓ_]}. This is used to determine the required plot size automatically: If the linear dimension r scales with $n^2$, then the volume scales with $n^6$. For a normalized wave function, we can then estimate that the probability density at a typical point will decrease with $1/n^6$. Therefore, I choose the threshold for the equi-probability contour to scale with this factor. Here is a check to verify what I said about the length scale:
Simplify[rMax[n, 0], n > 0]

(* ==> 2 n^2 *)
This is the largest achievable radius because I set the angular momentum l to zero.
In sphericalToCartesian, I write down how to convert to Cartesian coordinates (instead of using built-in functions which differ too much between Mathematica versions).
plotOrbital does the plotting for a given wave function f. In producing the grid of orbitals, I choose the parameters as described above.
Edit: volumetric slices
To show that the RegionPlot approach is also able to provide multiple contours, and to show how these layered contours can give us information about the volume in 3D, here I first combine several outputs of plotOrbital with different contour values in a single Show. The surfaces have been given their own PlotStyle. Then I put the resulting 3D graphics in a Manipulate that allows you to slice through the layers in real time:
With[{n = 3, l = 2, m = 0},
 orb = Show[
   Table[plotOrbital[ψ[n, l, m], 2 n^2, c/n^6,
     PlotStyle -> Directive[Opacity[0.6`], Hue[c]]], {c, 0.3`,
     0.05`, -0.04`}], PlotRange -> All, BoxRatios -> Automatic]]

With[{n = 3},
 Manipulate[
  Show[orb, Boxed -> False, Axes -> False,
   ViewVector -> {{35, -35, 5}, {0, 0, 0}}, ViewAngle -> Pi/4,
   PlotRange -> {{-#, #}, {y, #}, {-#, #}} &[2 n^2]], {y, -2 n^2,
   2 n^2}]]

The trick to get slices and hollow spaces between layers in RegionPlot3D is to cut off the plot with a reduced PlotRange. To still keep the object fixed in the view port (instead of moving around to stay centered with the changing PlotRange), I add fixed values for the ViewVector and ViewAngle. This trick using PlotRange doesn't work if you cut the range off directly inside the RegionPlot3D. You have to do it after the fact with Show.
Again, the drawing of multiple layers is very fast using RegionPlot3D. It could even be sped up more using ParallelTable.
