Using Adobe Acrobat I exported the file as XML and .DOC.
The first file can be read directly using
Import["SoLux Spectral Data.xls.xml", "XML"]
but you have to cut your way through the resulting XML expression tree.
The second method involves using MS Word. After opening the .doc file, I selected the table, copied it and pasted it in the following expression:
ImportString["","TSV"]
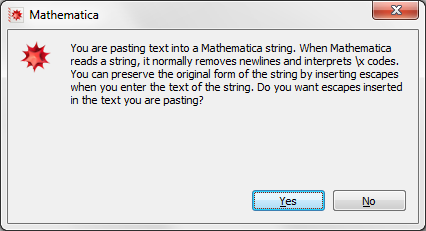
The insertion point should be precisely in the empty string (""). After pasting, you will get this dialog box:

Press "Yes", evaluate the result and you get:
> {{"Wavelength ", "4700K ", "4100K ", "3500K "}, {280, 0.049379,
0.054292, 0.0503}, {290, 0.075516, 0.037844, 0.034862}, {300,
0.11254, 0.030544, 0.028027}, {310, 0.16051, 0.033413,
0.029238}, {320, 0.23068, 0.067789, 0.055261}, {330, 0.32281,
0.20151, 0.13953}, {340, 0.40282, 0.43615, 0.25661}, {350, 0.45898,
0.57172, 0.52681}, {360, 1.2011, 0.82864, 1.3278}, {370, 1.8647,
1.5222, 1.6987}, {380, 2.5338, 2.3844, 3.61}, {390, 3.5809, 4.5686,
3.9927}, {400, 4.4137, 8.4548, 8.168}, {410, 5.2228, 14.205,
13.863}, {420, 6.0387, 17.949, 17.46}, {430, 6.9944, 21.068,
20.103}, ... }