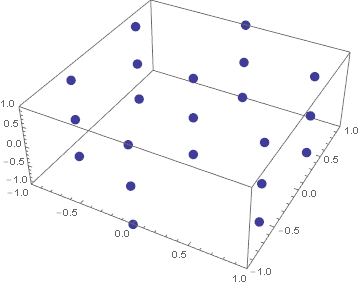
Both options PlotTheme -> None and PlotTheme -> "Classic" don't give the expected coloring for the points. However, you can set their color explicitly using PlotStyle -> Directive[PointSize[0.03], ColorData[1][1]]:
ListPointPlot3D[
  Partition[Flatten[Table[l u1 + p u2 + q u3, {l, -3, 3}, {p, -3, 3}, {q, -3, 3}]], 3],
  PlotRange -> {{-1, 1}, {-1, 1}, {-1, 1}},
  PlotStyle -> Directive[PointSize[0.03], ColorData[1][1]]]
Additional Observation:
Setting the PlotTheme to "Classic" or None without specifying a PlotStyle:
ListPointPlot3D[
  Partition[Flatten[Table[l u1 + p u2 + q u3, {l, -3, 3}, {p, -3, 3}, {q, -3, 3}]], 3],
  PlotRange -> {{-1, 1}, {-1, 1}, {-1, 1}}, PlotTheme -> "Classic"]
or
ListPointPlot3D[
      Partition[Flatten[Table[l u1 + p u2 + q u3, {l, -3, 3}, {p, -3, 3}, {q, -3, 3}]], 3],
      PlotRange -> {{-1, 1}, {-1, 1}, {-1, 1}}, PlotTheme -> None]
results in an error message
MapThread::mptd: Object Automatic at position {2, 2} in MapThread[Function[{Graphics`ListPointPlot3DDump`d$,Charting`s$},If[Last[Graphics`ListPointPlot3DDump`d$]===None,<<1>>,If[Head[First[<<1>>]]===Point&&FreeQ[Last[Graphics`ListPointPlot3DDump`d$],#1],{Charting`s$,Prepend[Last[<<31>>],(Point[<<1>>]&)[<<1>>]]},{Charting`s$,ReleaseHold[(<<1>>&)/@First[<<1>>]]}]]],<<1>>] has only 0 of required 1 dimensions. >>
and no plotted points.
This is not the case for all the other base themes, indicating that the behavior observed by the OP is indeed a bug in ListPointPlot3D.

