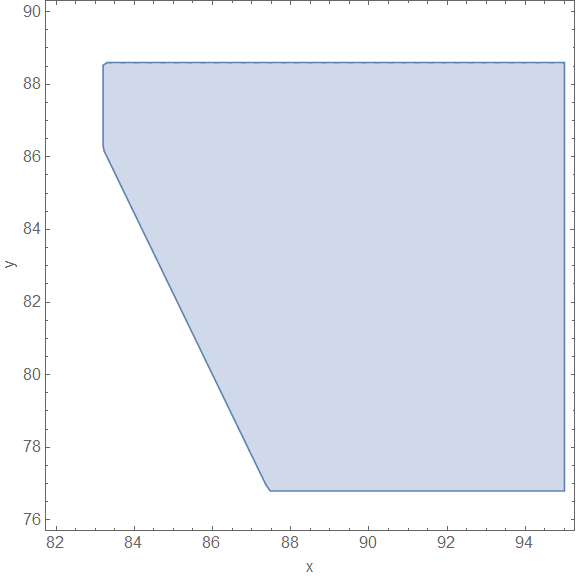
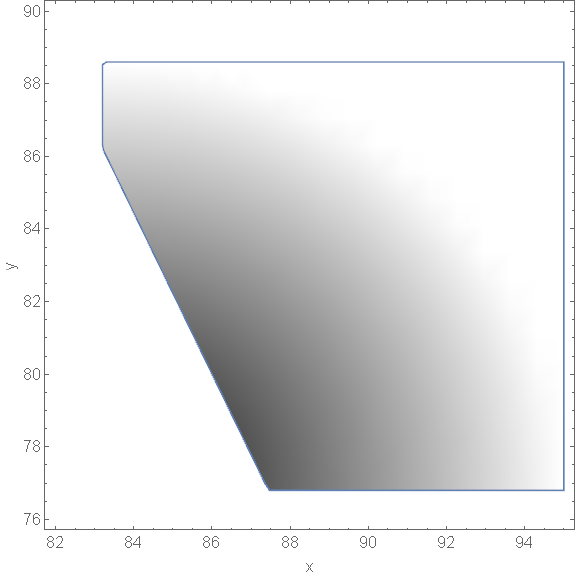
I reproduce what you observe in version 10.0.1 under Win7 x64: the on-screen appearance of the glyphs in tick labels and frame labels changes considerably after addition of ColorFunction (which introduces VertexColors into Graphics generated by RegionPlot). Here is the code I used to check the on-screen appearance:
pl1 = RegionPlot[
  x + 0.45 y >= 122. && y >= 76.8 && 83.2 <= x <= 101.7 &&
   y <= 88.6, {x, 82, 95}, {y, 76, 90}, PerformanceGoal -> "Quality",
  ImageSize -> Large, LabelStyle -> 16, FrameLabel -> {"x", "y"}]
pl2 = RegionPlot[
  x + 0.45 y >= 122. && y >= 76.8 && 83.2 <= x <= 101.7 &&
   y <= 88.6, {x, 82, 95}, {y, 76, 90},
  ColorFunction -> Function[{x, y}, Norm@{x, y}],
  PerformanceGoal -> "Quality", ImageSize -> Large, LabelStyle -> 16,
  FrameLabel -> {"x", "y"}]
FlipView[{pl1, pl2}]
Not only the on-screen appearance changes but also Export to raster formats produces different results:
Export["pl1.png", pl1]
Export["pl2.png", pl2]
But when I Export the plots as PDFs there is no difference in the appearance of the glyphs:
Export["pl1.pdf", pl1]
Export["pl2.pdf", pl2]
I suggest you to report it to the technical support.
I also confirm that the workaround through switching to ContourPlot works perfectly. The key is that Graphics generated by ContourPlot does not contain VertexColors.


