As of version 11, this is built in:
GraphData["SierpinskiCarpet"]
(* {{"Cycle", 8}, {"SierpinskiCarpet", 2}, {"SierpinskiCarpet", 3}, {"SierpinskiCarpet", 4}} *)
GraphData /@ %

----
The latest version of [IGraph/M][1] incorporates [Henrik Schumacher's mesh/graph conversion functions][2]. This way we can easily obtain the face-adjacency graph of a [`MengerMesh`](http://reference.wolfram.com/language/ref/MengerMesh.html), and add the appropriate vertex coordinates.
Needs["IGraphM`"]
With[{mesh = MengerMesh[4]},
IGMeshCellAdjacencyGraph[mesh, 2,
VertexCoordinates -> PropertyValue[{mesh, {2, All}}, MeshCellCentroid]
]
]

How about a 3D one?
With[{mesh = MengerMesh[2, 3]},
IGMeshCellAdjacencyGraph[mesh, 3,
VertexCoordinates -> PropertyValue[{mesh, {3, All}}, MeshCellCentroid]
]
]

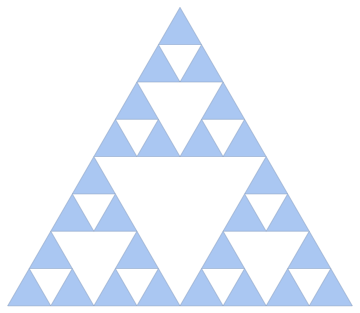
What if we want a Sierpinski graph? The mesh looks like this:
mesh = SierpinskiMesh[3]

This time each face (shaded triangle) will correspond to a graph node, and two triangles are connected if they share a vertex. We construct the face-vertex incidence matrix `bm`. To obtain our graph's adjacency matrix, we need those elements of `bm.Transpose[bm]` which are `1`. We enlist the help of the [BoolEval package][3] for this.
bm = IGMeshCellAdjacencyMatrix[mesh, 2 (* face, i.e. 2D *), 0 (* vertex, i.e. 0D *)];
Needs["BoolEval`"]
AdjacencyGraph[
BoolEval[bm.Transpose[bm] == 1],
VertexCoordinates -> PropertyValue[{mesh, {2, All}}, MeshCellCentroid]
]

[1]: http://szhorvat.net/mathematica/IGraphM
[2]: https://mathematica.stackexchange.com/a/160457/12
[3]: https://mathematica.stackexchange.com/a/2822/12