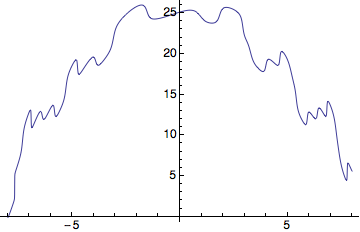
For a continuous function you could do something like this:
SetAttributes[argPlot, HoldAll];
Options[argPlot] = Options[Plot];
argPlot[exp_, {x_, x0_, x1_}, opt : OptionsPattern[argPlot]] :=
Module[{pts, pl},
pl = Plot[Arg[exp], {a, x0, x1}, PlotRange -> All,
PlotPoints -> OptionValue[PlotPoints]];
pts = SortBy[Cases[pl, Line[pts_] :> pts, Infinity], #[[1, 1]] &];
pts = Reap[Fold[Module[{ptsn},
ptsn = #2;
ptsn[[All, 2]] -= Round[ptsn[[1, 2]] - #1, 2 Pi];
Sow[ptsn];
ptsn[[-1, 2]]] &, 0, pts];][[2, 1]];
ListLinePlot[Flatten[pts, 1], opt]]
argPlot[3 + 2 Exp[3 I a] + Exp[(1 - I a^2)], {a, -8, 8}]

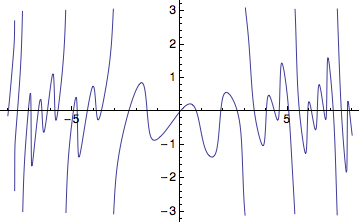
Compared to an ordinary plot of the `Arg[3 + 2 Exp[3 I a] + Exp[(1 - I a^2)]]`
Plot[Arg[3 + 2 Exp[3 I a] + Exp[(1 - I a^2)]], {a, -8, 8}, PlotRange -> All]
