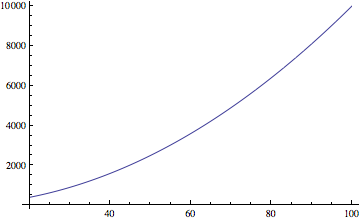
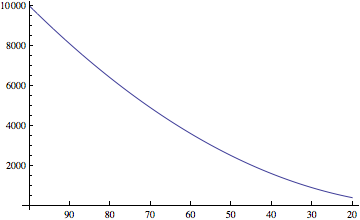
I want to make a 2D plot where the x-axis is flipped so the higher numbers are on the right and lower numbers are on the left.
I've managed to do it by flipping the data and making new Ticks but this solution is manually and requires manipulating the data. I was hoping there was a better way.
For the normal plot:
data = Table[{x, x^2}, {x, 20, 100}];
ListLinePlot[data]

And for the flipped data and the new plot:
data = Table[{100 - x + 20, x^2}, {x, 20, 100}];
ticks = Table[{x, 100 - x + 20}, {x, 20, 100, 10}]
ListLinePlot[data, Ticks -> {ticks, Automatic}]

I couldn't seem to find any options like ReverseAxis.
