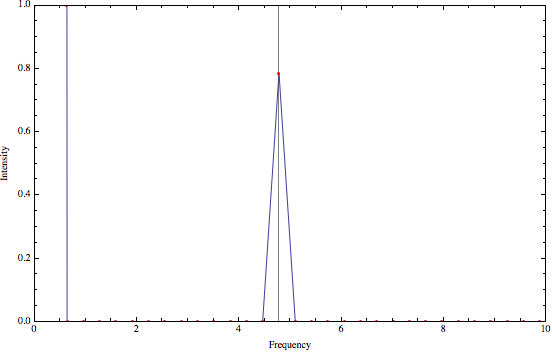
This is just a long comment to @James Cunnane's answer which is correct. Try
dt = 1/100;
ls = Table[0.1 Cos[30 x] + 2 Sin[x]^2, {x, 0, Pi, dt}];
ListPlot[ls, Mesh -> All, MeshStyle -> Red]
ListPlot[Abs[Fourier[ls]]^2, PlotRange -> {{0, 10}, {0, 1}},
DataRange -> {0, 1/dt}, FrameLabel -> {"Frequency", "Intensity"},
Mesh -> All, MeshStyle -> Red, GridLines -> {{30/(2 \[Pi])}, None},
Frame -> True, Joined -> True]

Note the only thing changed is the duration whose inverse (1/Pi) defines the grid size in the Fourier spectrum. As a result, the desired frequency 30/Pi is now an integer multiple of the grid size and therefore can be captured correctly.
