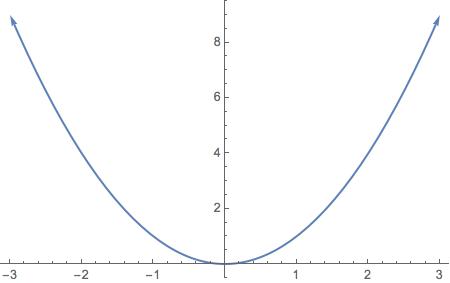
The command
Plot[x^2, {x, -3, 3}, PlotStyle -> Arrowheads[{-.025, .025}]] /.Line -> Arrow
produces this output.

What I don't understand is what Line has to do with anything. It must be the case that the Plot command produces Line objects that can be replaced with Arrow. I haven't seen anything in the documentation for Plot that suggests this is the case.
Without /.Line->Arrow the plot won't have arrowheads at the ends of the graph of the function.
