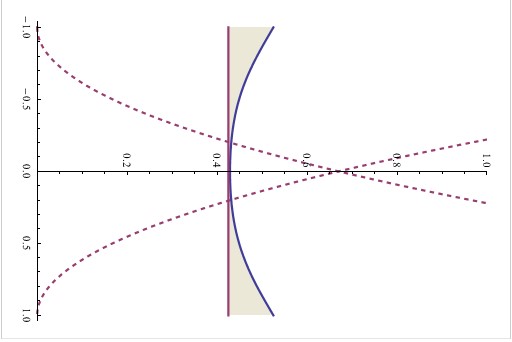
My question is on trying to cut off certain plots within a `Plot` with multiple expressions being plotted. I want to be able to stop the two dashed-line plots at their point of intersection, without affecting how the other two plots are rendered. Please see the image below:  Is there a way to limit the plotting range to a certain value for some of the expressions, but not the others? Again, I want the two dashed lines to stop plotting at the point where they intersect. This image shows 4 different plots: two quadratic functions that are offset by 1 and -1, a straight line, and a parabolic function.