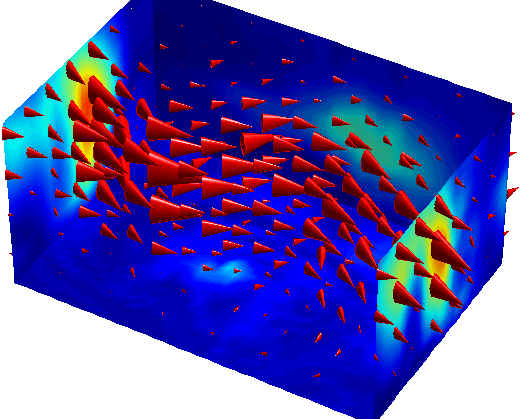
Does Mathematica have a function, similar to the one called coneplot in MatLAB? Given some spatial coordinates $x, y, z$ and velocity components $v_x,v_y,v_z$, it is able to produce the following graphs:

When I plot my data, I don't get anything. Here is a sample data, on the form $(x,y,z,v_x,v_y,v_z)$:
{{{0., 1.65178, 3.8905}, {0.5, 0.05, 0.}}, {{0.00180262, -0.0214412, 3.7307}, {0.5, 0.1, 0.}}, {{-0.23312, -0.121457, 3.89493}, {0.5, 0.15, 0.}}, {{0., 1.65178, 4.46773}, {0.5, 0.2, 0.}}, {{0., 1.65178, 5.1253}, {0.5, 0.25, 0.}}, {{0., 1.65178, 5.7829}, {0.5, 0.3, 0.}}, {{0., 1.65178, 6.3849}, {0.5, 0.35, 0.}}, {{0., 1.65178, 6.8104}, {0.5, 0.4, 0.}}, {{0., 1.65178, 7.1067}, {0.5, 0.45, 0.}}, {{0., 1.65178, 7.4203}, {0.5, 0.5, 0.}}, {{0., 1.65178, 7.7342}, {0.5, 0.55, 0.}}, {{0., 1.65178, 8.17577}, {0.5, 0.6, 0.}}, {{0., 1.65178, 8.74073}, {0.5, 0.65, 0.}}, {{0., 1.65178, 9.35703}, {0.5, 0.7, 0.}}, {{0., 1.65178, 10.0875}, {0.5, 0.75, 0.}}, {{0., 1.65178, 10.7561}, {0.5, 0.8, 0.}}, {{-0.252814, -0.0423189, 4.37793}, {0.5, 0.85, 0.}}, {{-0.258939, -0.142421, 4.9979}, {0.5, 0.9, 0.}}, {{-0.259465, -0.127003, 5.6536}, {0.5, 0.95, 0.}}, {{-0.257568, -0.140359, 6.19427}, {0.5, 1., 0.}}}
