I have a list of {x,y,z} pairs representing points in $R^3$. For every unique value of z there are many {x,y} pairs defining a polygon/contour in that particular z-plane. My dataset looks like this:
Input:= Take[ptv, 3]
Output= {{61.52, -217.26, -80}, {63.48, -217.64, -80}, {65.43, -217.64, -80}}
These are the coordinates of points residing on the z=-80 plane. There are other pairs for z=-75, z=-70, etc. Therefore ptv is of the form:
ptv: {{$x_1$,$y_1$,-80}, {$x_2$,$y_2$,-80}, ..., {$x_k$,$y_k$,-80}, ..., {$x_1$,$y_1$,-75}, ...}}
My goal is to create a 3D surface where:
- the points in every z-plane are connected into a polygon/contour and
- the points in every z-plane are connected with their neighbors in the immediately above and below plane.
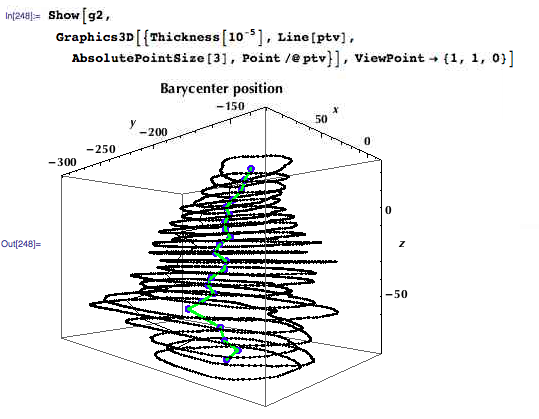
Currently, I have achieved 1., via:
Graphics3D[Line[ptv], Point /@ ptv}]
The result looks like this:

If I, instead, use:
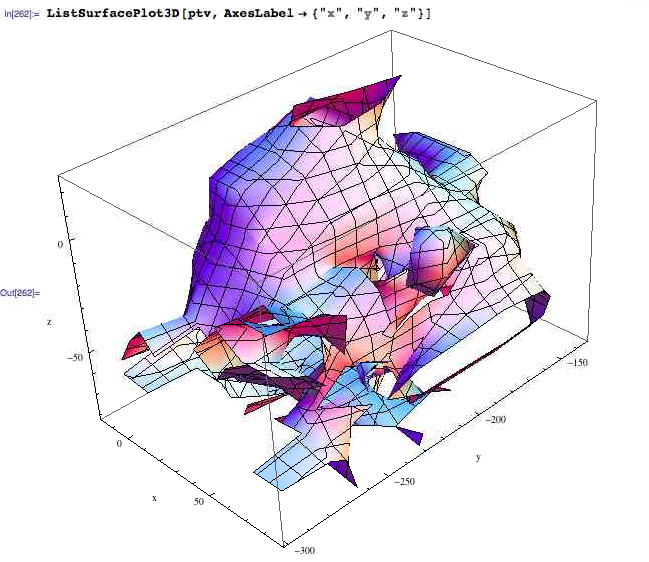
ListSurfacePlot3D[ptv, AxesLabel->{"x","y","z"}]
I get some ugly artifacts (edges at the boundaries of the volume) as shown here:

Whereas, I was expecting a more "smooth" surface without any "openings". Any hints on:
- Whether
ListSurfacePlot3D[]is the proper function to call (e.g. in the documentation it is mentioned thatListSurfacePlot3D[]may "fold" over) or - What other alternatives I need to consider ?
