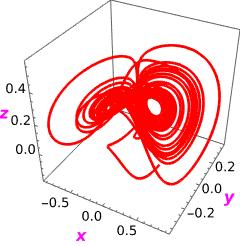
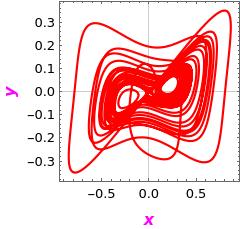
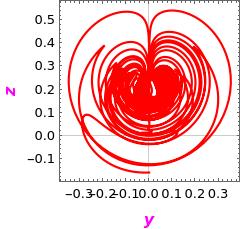
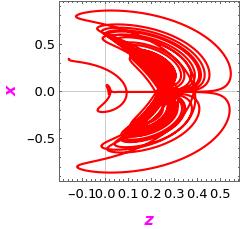
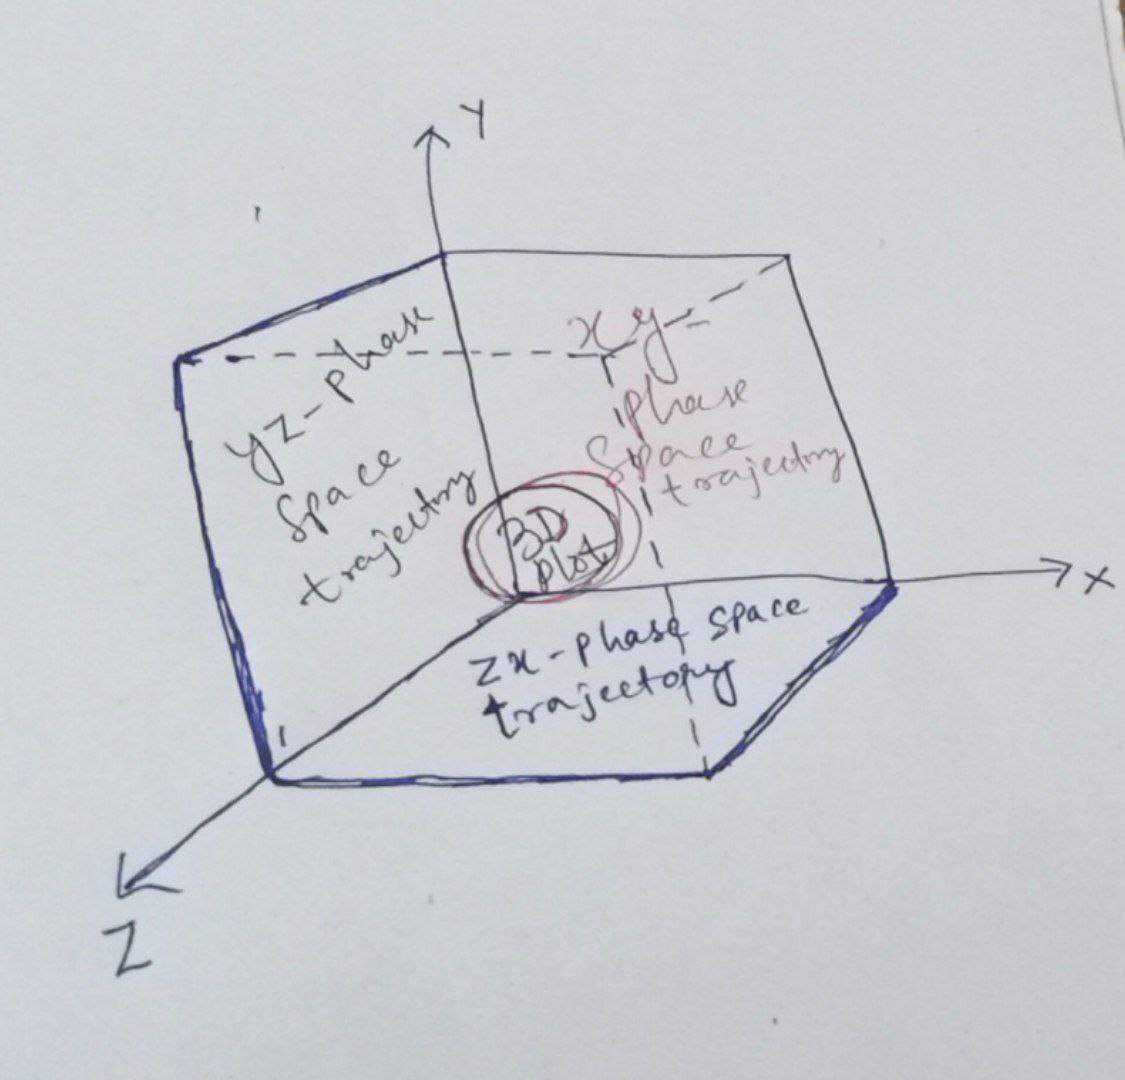
I have a 3D chaotic system and its one 3D phase-space portrait and three 2D phase-space portrait (x-y plane, y-z plane, z-x plane) are given below.
s = NDSolve[{Derivative[1][x][t] == -0.4*x[t] + y[t] + 10.0*y[t]*z[t],
     Derivative[1][y][t] == -x[t] - 0.4*y[t] + 5.0*x[t]*z[t],
    Derivative[1][z][t] == 0.175*z[t] - 5.0*x[t]*y[t], x[0] == 0.349,
    y[0] == 0.0, z[0] == -0.160}, {x, y, z}, {t, 0, 600, 0.01},
   MaxSteps -> \[Infinity]];
p1 = ParametricPlot3D[Evaluate[{x[t], y[t], z[t]} /. s], {t, 0, 300},
  PlotRange -> Full, PlotPoints -> 200,
  AxesLabel -> {Style[x, Medium, Bold, Magenta],
    Style[y, Medium, Bold, Magenta],
    Style[z, Medium, Bold(*Plain*), Magenta]},
  LabelStyle -> Directive[Black, Plain], PlotTheme -> "Scientific",
  PlotStyle -> Red, ImageSize -> Small, BoxRatios -> {1, 1, 1}]
p2 = ParametricPlot[Evaluate[{x[t], y[t]} /. s], {t, 0, 300},
  PlotRange -> Full, PlotPoints -> 200,
  FrameLabel -> {Style[x, Medium, Bold, Magenta],
    Style[y, Medium, Bold, Magenta]},
  LabelStyle -> Directive[Black, Plain], PlotTheme -> "Scientific",
  PlotStyle -> Red, ImageSize -> Small, AspectRatio -> 1]
p3 = ParametricPlot[Evaluate[{y[t], z[t]} /. s], {t, 0, 300},
  PlotRange -> Full, PlotPoints -> 200,
  FrameLabel -> {Style[y, Medium, Bold, Magenta],
    Style[z, Medium, Bold(*Plain*), Magenta]},
  LabelStyle -> Directive[Black, Plain], PlotTheme -> "Scientific",
  PlotStyle -> Red, ImageSize -> Small, AspectRatio -> 1]
p4 = ParametricPlot[Evaluate[{z[t], x[t]} /. s], {t, 0, 300},
  PlotRange -> Full, PlotPoints -> 200,
  FrameLabel -> {Style[z, Medium, Bold, Magenta],
    Style[x, Medium, Bold(*Plain*), Magenta]},
  LabelStyle -> Directive[Black, Plain], PlotTheme -> "Scientific",
  PlotStyle -> Red, ImageSize -> Small, AspectRatio -> 1]
I can plot all these trajectories individually. But I want to plot all these four diagrams in a single figure just like the schematic diagram I have shown below.
Can anybody tell me how to do this?

