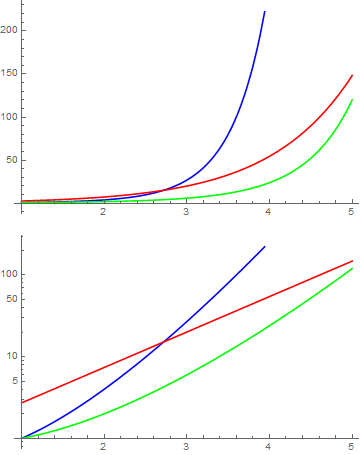
This should work, using a replacement rule to replace every `y` value with a scaled version, and then making sure that you have a scaled tick mark function as well
plot = Plot[{x^x, Exp[x], x!}, {x, 1, 5},
PlotStyle -> {Blue, Red, Green}]
Show[plot /. Line[x__] :> (({#1, Log@#2} & @@@ x) // Line),
PlotRange -> All,
Ticks -> {Automatic, Charting`ScaledTicks[{Log, Exp}]}]

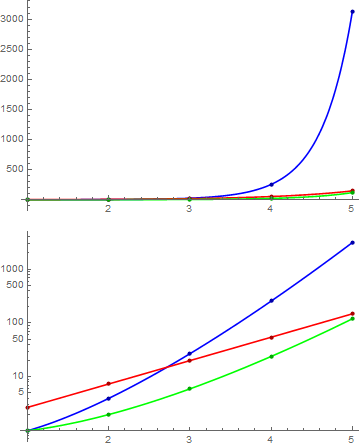
Or, with OP's example more explicitly
listplot =
ListPlot[Transpose[{#^#, Exp[#], #!} & /@ Range[1, 5]],
PlotStyle -> {Darker@Blue, Darker@Red, Darker@Green}];
plot = Plot[{x^x, Exp[x], x!}, {x, 1, 5},
PlotStyle -> {Blue, Red, Green}, PlotRange -> All];
combined = Show[plot, listplot]
Show[combined /.
{Line[x__] :> (({#1, Log@#2} & @@@ x) // Line),
Point[x__] :> (({#1, Log@#2} & @@@ x) // Point)},
PlotRange -> All,
Ticks -> {Automatic, Charting`ScaledTicks[{Log, Exp}]}]
