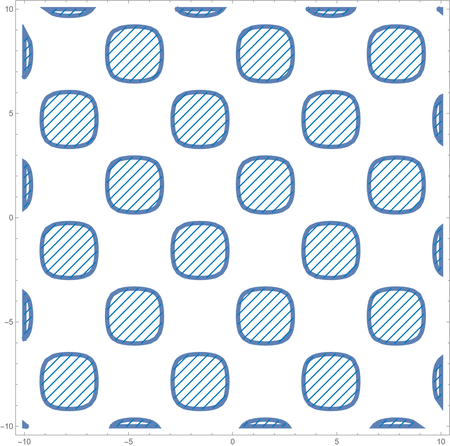
Export such drawing to pdf is not a vector format pdf file. We use Mesh to draw such hatchfilling instead.
plot = RegionPlot[Sin[x] Sin[y] > 1/4, {x, -10, 10}, {y, -10, 10},
  BoundaryStyle -> Thickness[0.01], PlotStyle -> None, Mesh -> 80,
  MeshFunctions -> {#2 - #1 &},
  MeshStyle -> {RGBColor["#0077BB"], AbsoluteThickness[1.5]}]
Export["test.pdf", plot] // SystemOpen


- For
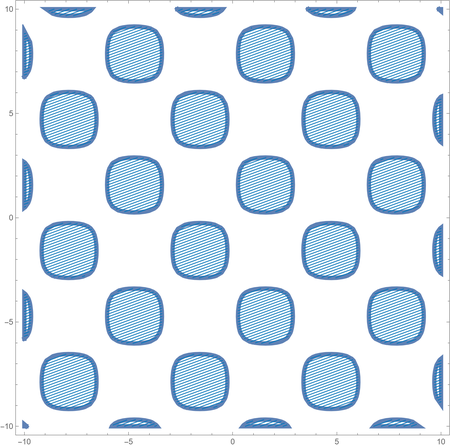
20 Degree slope, since the equation of such lines are y=Tan[20 Degree] x+b( where b is variety), so we can set MeshFunctions -> {#2 - Tan[20 Degree] #1 &} to change the angle of lines.
Clear[plot];
plot =
 RegionPlot[Sin[x] Sin[y] > 1/4, {x, -10, 10}, {y, -10, 10},
  BoundaryStyle -> Thickness[0.01], PlotStyle -> None, Mesh -> 200,
  MeshFunctions -> {#2 - Tan[20 Degree] #1 &},
  MeshStyle -> {RGBColor["#0077BB"], AbsoluteThickness[1]}];
Export["test.pdf", plot] // SystemOpen


