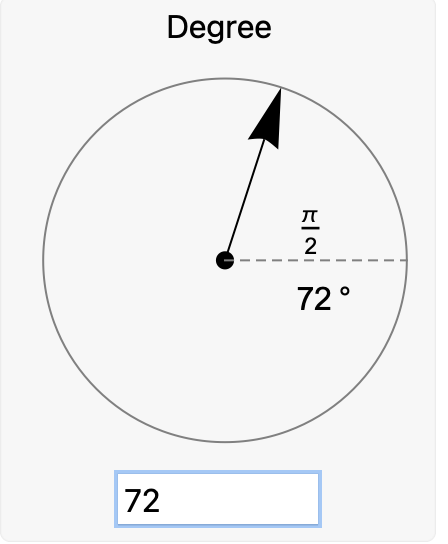
I think this is an example closer to the requirements of the question:
dynamic linkage of LocatorPane and InputField.
InputField and Overlay and
DynamicModule[{z = 120},
 Panel@Column[{Style["Degree", 16],
    Overlay[{Experimental`AngularSlider[
       Dynamic[z, (z = Round[#, 1]) &], {0, 360},
       Experimental`BoundaryAction -> "Wrap", ImageSize -> 200],
      Graphics[{Text[
         Framed[Style[Dynamic[Round[z, 1]] \[Degree], 16],
          FrameStyle -> None], Scaled@{3/4, 4/10}, {-1, 1}],
        Text[Framed[Style[Dynamic[Round[z Degree, Pi/2^7]], 16],
          FrameStyle -> None], Scaled@{3/4, 4/10}, {-1, -1}]}]}, All,
     1], InputField[Dynamic[z, (z = Round[#, 1]) &],
     ImageSize -> {100, 24}, BaseStyle -> 16]}, Alignment -> Center]]
This is an example moving the framed text around even in a plot:
automatic-placement-of-legend-box-with-placed-equivalent-to-best-in-matplot
This shows how to define Your own overlay graphics and display them dynamically over a given background object:
From the Mathematica Overlay documentation stems the idea to overlay plot on texts:
Overlay[{StringTake[ExampleData[{"Text", "ToBeOrNotToBe"}], 400],
  Plot[Sin[E^-x], {x, 0, 5}]}]
The splines are done with Spline offered in the standard of Mathematica.
There is only the need to put this all together. There is an example over at the Mathematica Demonstration named Pottery Wheel to draw such nice Splines.
Only some simple steps to show such a nice text analysis in a slide show.

