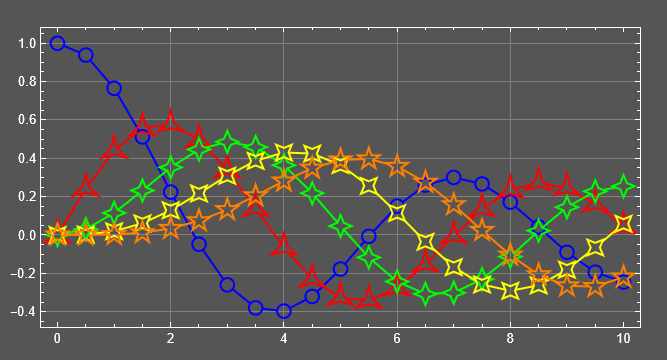
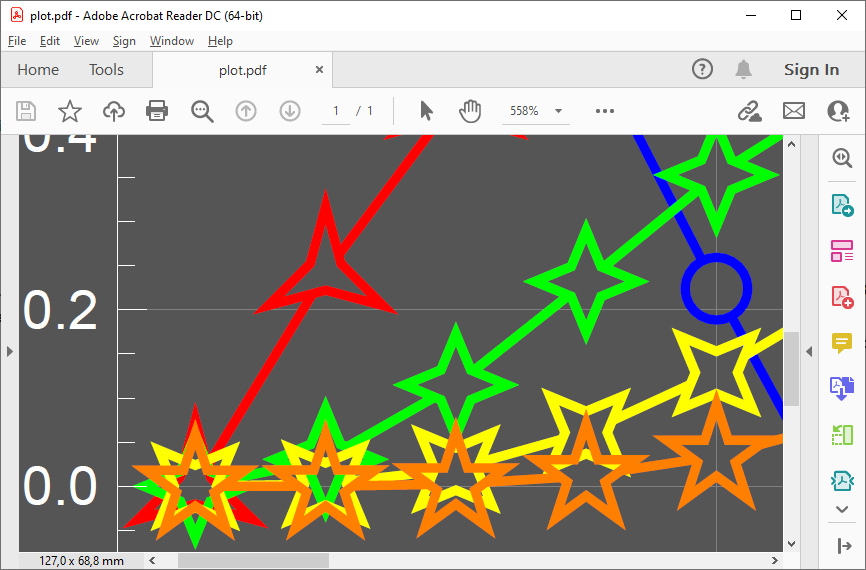
Here I construct a purely vector figure with completely transparent plot markers using Region functionality. The advantage of this approach is that the plot markers are really transparent, as opposed to my previous answer, where the transparency was a simulation. The plotted lines do not go through the markers, because the corresponding portions of them are explicitly removed using RegionDifference. The parameter aspectRatio here defines the aspect ration of the padded plot range (not of the whole figure), as it does the option AspectRatio. The amount of padding should be controlled using the parameners of the padPlotRange function. The perfect result is achieved when the options AspectRatio -> aspectRatio and PlotRange -> paddedPlotRange, PlotRangePadding -> None are set for the final Graphics.
Input:
data = Table[{x, BesselJ[k, x]}, {k, 0, 4}, {x, 0, 10, 0.5}];
aspectRatio = 1/2;
markers = {"Circle", "ThreePointedStar", "FourPointedStar",
   "DiagonalFourPointedStar", "FivePointedStar"};
colors = {Blue, Red, Green, Yellow, Orange};
background = Darker@Gray;
Auxiliary functions:
Clear[padPlotRange, rescaleCoords, rescaleCoordsBack, putMarker, createLineWithMarkers]
padPlotRange[xPadding_ : .01, yPadding_ : .02][{{xMin_, xMax_}, {yMin_, yMax_}}] :=
 Module[{xd, yd},
  xd = (xMax - xMin)*xPadding;
  yd = (yMax - yMin)*yPadding;
  {{xMin - xd, xMax + xd}, {yMin - yd, yMax + yd}}
  ]
rescaleCoords[paddedPlotRange_, aspectRatio_][pts_] :=
 Module[{xCoords = pts[[All, 1]], yCoords = pts[[All, 2]], xResc, yResc},
  xResc = Rescale[#, paddedPlotRange[[1]], {0, 1}] & /@ xCoords;
  yResc =
   Rescale[#, paddedPlotRange[[2]], {0, aspectRatio}] & /@ yCoords;
  Transpose[{xResc, yResc}]
  ]
rescaleCoordsBack[paddedPlotRange_, aspectRatio_][pts_] :=
 Module[{xCoords = pts[[All, 1]], yCoords = pts[[All, 2]], xResc, yResc},
  xResc = Rescale[#, {0, 1}, paddedPlotRange[[1]]] & /@ xCoords;
  yResc =
   Rescale[#, {0, aspectRatio}, paddedPlotRange[[2]]] & /@ yCoords;
  Transpose[{xResc, yResc}]
  ]
putMarker[marker_Polygon][pts_] :=
  Polygon /@ Table[# + vect & /@ marker[[1]], {vect, pts}];
createLineWithMarkers[marker_, pts_, size_ : .02] :=
 Module[{markerPrims, linePrims},
  markerPrims =
   putMarker[ResourceFunction["PolygonMarker"][marker, size]][pts];
  linePrims =
   MeshPrimitives[
    RegionDifference[Line[pts], RegionUnion @@ markerPrims], 1];
  Join[{CapForm[None]}, linePrims, markerPrims]
  ]
Plotting:
dataRange = MinMax /@ Transpose[Flatten[data, 1]];
paddedPlotRange = padPlotRange[.03, .06]@dataRange;
dataResc = rescaleCoords[paddedPlotRange, aspectRatio] /@ data;
primitivesResc =
  Table[{colors[[i]], AbsoluteThickness[1.5], FaceForm[None],
    EdgeForm[{colors[[i]], AbsoluteThickness[1.5],
      JoinForm[{"Miter", 6}]}],
    createLineWithMarkers[markers[[i]], dataResc[[i]], .02]}, {i,
    Length[dataResc]}];
primitives =
  primitivesResc /. (h : Line | Polygon)[pts_] :>
    h@rescaleCoordsBack[paddedPlotRange, aspectRatio][pts];
pl = Graphics[primitives, AspectRatio -> aspectRatio,
  ImageSize -> 500, Frame -> True, Background -> background,
  FrameStyle -> White, ImagePadding -> {{30, 20}, {25, 20}},
  GridLines -> Automatic, PlotRange -> paddedPlotRange,
  PlotRangePadding -> None]
Exporting to PDF and looking closer:
Export["plot.pdf", pl] // SystemOpen
Looks perfect.


