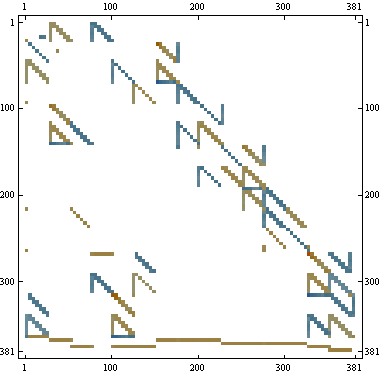
What I'm actually trying to do is to elaborate this question. I'd like to use Pane with scrollbars enabled to explore large (sparse) matrices like this one:

Here is what I have so far using some ideas from this answer:
A = ExampleData[{"Matrix", "HB/west0381"}, "Matrix"] // Normal;
{n, m} = Dimensions@A;
mp = MatrixPlot[A, ImageSize -> 9 m, Mesh -> All];
DynamicModule[{trans, ij, mpos},
 trans[{x_, y_}] := {Clip[Floor[n - y] + 1, {1, n}],
   Clip[Floor@x + 1, {1, m}]};
 Pane[
  Show[mp, ImagePadding -> {{40, 20}, {20, 20}},
   Epilog -> Text[
      Framed[
       Dynamic[(ij = trans@MousePosition["Graphics", {0, 0}]) ->
         A[[Sequence @@ ij]]], Background -> White],
      Dynamic[MousePosition["Graphics", {0, 0}]],
      {1, -1}
      ]~Style~Larger
   ],
  {500, 500},
  Scrollbars -> True]
 ]
The result is

Now about the problems
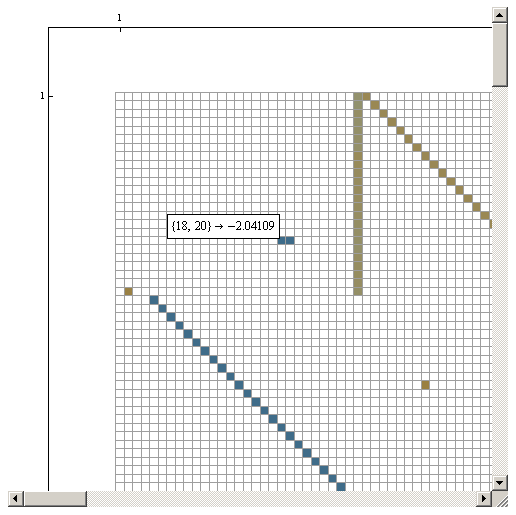
1. The main trouble is that it does not correctly translate coordinates for horizontal scrolling. If we don't touch the horizontal scrollbar everything is fine:

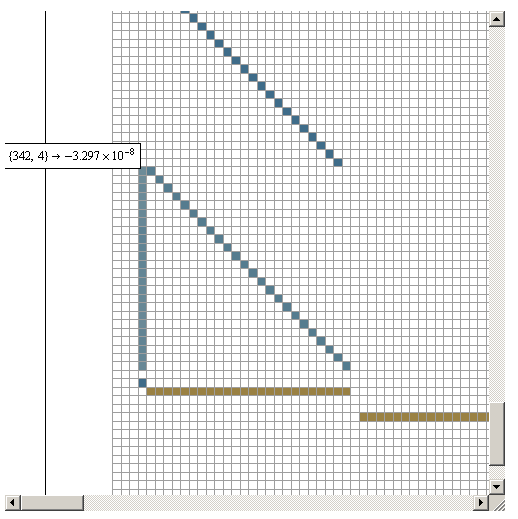
But if I slide horizontally the label shifts and falls outside the visible area. It looks like a Mma bug.
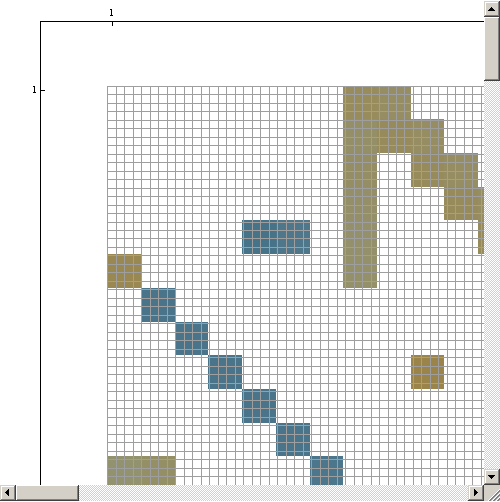
2. The second funny thing is that if I remove //Normal from the first row then MatrixPlot produces the following:

which seems to be the second bug.
3. And finally the issue which is due to my confusion with Dynamic things. In the code I use MousePosition["Graphics", {0, 0}] twice (can this be the reason for the item 1 from above?). When I tried to save this coordinates in a variable I had no luck. But there must be a way to do this.
SUMMARY
Thanks to Andy for resolving problems number 2 and 3, and to David for nice solution using MouseAnnotation. I accept kguler's answer since it resolves the main problem with runaway tooltip by effectively using CoordinatesToolOptions option. Here is complete working example with kguler's solution. Try it (to enable the tooltip right-click on the plot and select "Get Coordinates"):
mtrxPlot2[mat_, opts : OptionsPattern[]] :=
 With[{dims = Dimensions[mat],
   indx = {Clip[Floor[#1[[1]] - #2[[2]]] + 1, {1, #1[[1]]}],
      Clip[Floor[#2[[1]]] + 1, {1, #1[[2]]}]} &},
  With[{copiedvalues =
     "CopiedValueFunction" ->
      Function[pt, {indx[dims, pt], Extract[mat, indx[dims, pt]]}],
    coordtooltips =
     "DisplayFunction" ->
      Function[pt,
       Row[{"mat[[", Row[indx[dims, pt], ","], "]]  =  ",
         Extract[mat, indx[dims, pt]]},
        Background -> White,
        ImageSize -> {Automatic, 30},
        ImageMargins -> {{5, 5}, {10, 10}},
        Alignment -> Center]]},
   MatrixPlot[mat, opts,
    CoordinatesToolOptions -> {coordtooltips, copiedvalues}]
   ]
  ]

A = ExampleData[{"Matrix", "HB/west0381"}, "Matrix"];
Pane[mtrxPlot2[A, ImageSize -> 3000, Mesh -> All,
  MaxPlotPoints -> 500], {500, 500}, Scrollbars -> True]
