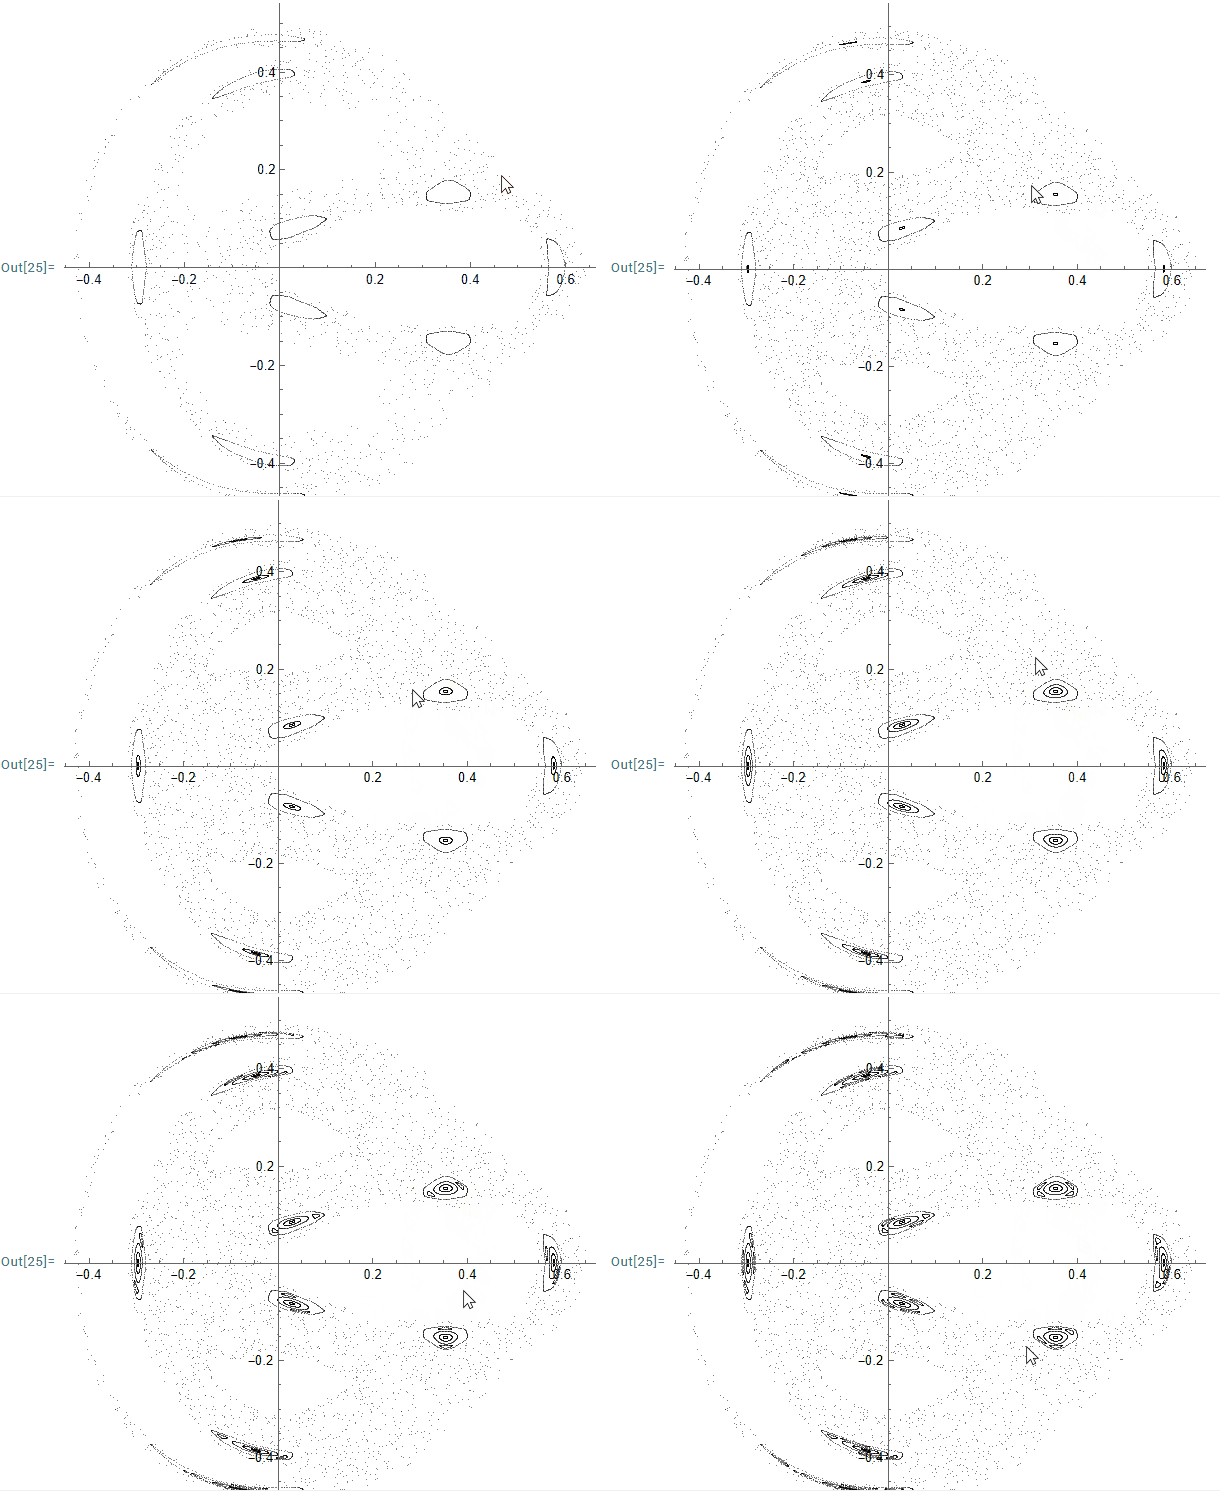
With the following code, you can plot the Poincaré sections of the Hénon-Heiles system:
With[{icv = {0, 0.36169437164930385`, 0.20100851639176504`, 0.029106357137938632`}},
psection = Reap[NDSolve[{x'[t] == px[t], px'[t] == -(x[t] + 2 x[t]* y[t]),
y'[t] == py[t], py'[t] == -(y[t] + x[t]^2 - y[t]^2),
x[0] == icv[[1]], px[0] == icv[[2]], y[0] == icv[[3]],
py[0] == icv[[4]]}, {x, px, y, py}, {t, 0, 1000},
MaxSteps -> ∞,
Method -> {"EventLocator", "Event" -> x[t],
"EventAction" :> Sow[{y[t], py[t]}]}]][[2]];]
We load the MaTeX package for labels with LaTeX:
Needs["MaTeX`"];
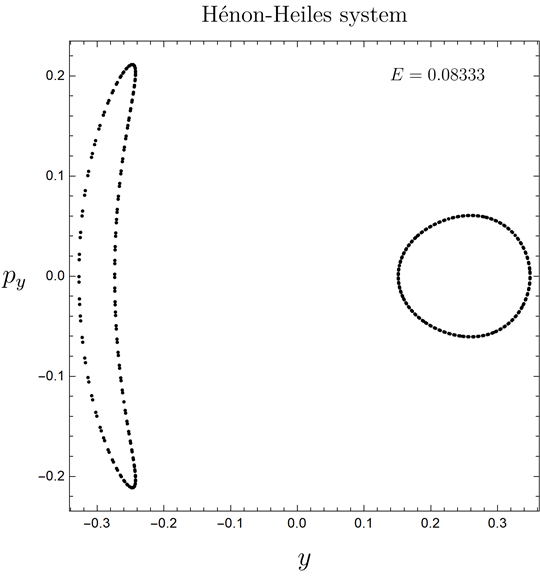
Finally, we plot de Poincaré section:
ListPlot[section, PlotRange -> All, AspectRatio -> 1, PlotStyle -> Black,
Frame -> True, FrameStyle -> Black, Axes -> False, LabelStyle -> Directive[Black, Small],
FrameLabel -> {{MaTeX["p_{y}", Magnification -> 1.5], None},
{MaTeX["y", Magnification -> 1.5],
MaTeX["\\text{Hénon-Heiles system}", Magnification -> 1.3]}},
RotateLabel -> False, Epilog -> Inset[MaTeX["E=0.08333", Magnification -> 1],
{0.21, 0.15}, Automatic, 1], ImageSize -> Medium]
The Poincaré section:
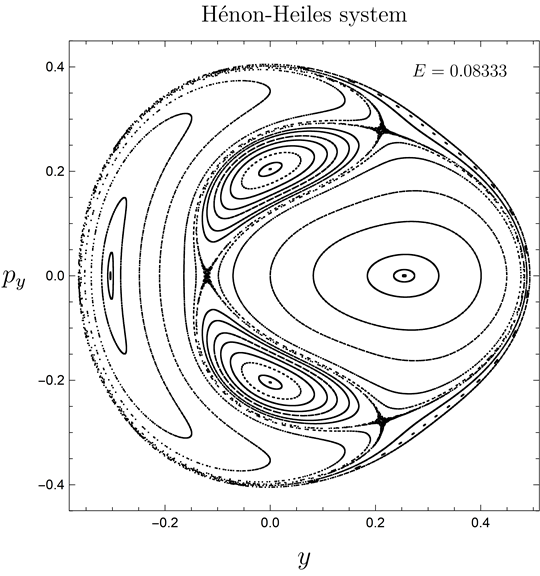
You can use a For loop to compute with more initial conditions subject to the energy constraint of the Hénon-Heiles system. For more details, see my answer Poincaré Sections for spring pendulum.
With many initial conditions:
With[{icv = {{0, 0.4082401254164024`, 0, 0},
{0, 0.24008038662195985`, -0.15316368171208566`, 0.28838672839135326`},
{0, 0.24352018790129148`, 0.09848498536170303`, 0.3135210500944904`},
{0, 0.20788819727584018`, 0.18687849877360435`, 0.3047456328865395`},
{0, 0.11124773284074371`, 0.24234454959281115`, 0.32410152798705066`},
{0, 0.09612790055948518`, 0.2562151235263743`, 0.32091473672760257`},
{0, 0.14504873906640348`, 0.2433184249171519`, 0.3098719090788399`},
{0, 0.21466692008332666`, 0.21341797098009158`, 0.2855018063099425`},
{0, 0.2242200636897092`, 0.21057030870037158`, 0.27976766448196655`},
{0, 0.3683386516212832`, 0.18778901046261137`, 0.011696534024095057`},
{0, 0.3451153373835715`, 0.23762310035771178`, 0.005962392196119196`},
{0, 0.33504538978074816`, 0.256132905175892`, 0.0016617858251372995`},
{0, 0.37097564355830726`, -0.03575247849541091`, 0.1665183633794433`},
{0, 0.37507484064199426`, -0.06280527015275122`, 0.14788240243852177`},
{0, 0.3774580162329546`, -0.08416273725065143`, 0.12924644149760023`},
{0, 0.3779249463635693`, -0.09982487978911159`, 0.11491108692766056`},
{0, 0.3818158505457779`, -0.10979169776813169`, 0.08910744870176919`},
{0, 0.3850735819245613`, -0.11406319118771174`, 0.06617088138986574`},
{0, 0.3571135001050445`, -0.02151416709681081`, 0.1966226079763166`},
{0, 0.3537329768656702`, -0.0015805311387706023`, 0.20379028526128642`}}},
psection = Reap[
Table[NDSolve[{x'[t] == px[t], px'[t] == -(x[t] + 2 x[t]* y[t]),
y'[t] == py[t], py'[t] == -(y[t] + x[t]^2 - y[t]^2),
x[0] == Part[icv[[i]], 1], px[0] == Part[icv[[i]], 2],
y[0] == Part[icv[[i]], 3], py[0] == Part[icv[[i]], 4]}, {x,
px, y, py}, {t, 0, 5000}, MaxSteps -> \[Infinity],
Method -> {"EventLocator", "Event" -> x[t],
"EventAction" :> Sow[{y[t], py[t]}]}], {i, 1, Length[icv]}]][[2]];]
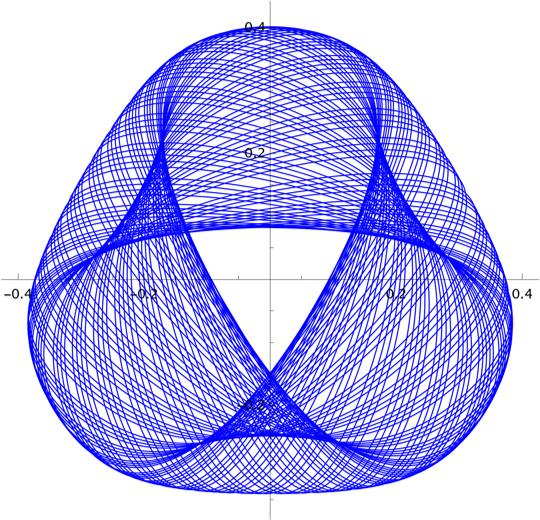
Trajectories:
With[{icv = {{0, 0.4082401254164024`, 0, 0},
{0, 0.24008038662195985`, -0.15316368171208566`, 0.28838672839135326`},
{0, 0.24352018790129148`, 0.09848498536170303`, 0.3135210500944904`},
{0, 0.20788819727584018`, 0.18687849877360435`, 0.3047456328865395`},
{0, 0.11124773284074371`, 0.24234454959281115`, 0.32410152798705066`},
{0, 0.09612790055948518`, 0.2562151235263743`, 0.32091473672760257`},
{0, 0.14504873906640348`, 0.2433184249171519`, 0.3098719090788399`},
{0, 0.21466692008332666`, 0.21341797098009158`, 0.2855018063099425`},
{0, 0.2242200636897092`, 0.21057030870037158`, 0.27976766448196655`},
{0, 0.3683386516212832`, 0.18778901046261137`, 0.011696534024095057`},
{0, 0.3451153373835715`, 0.23762310035771178`, 0.005962392196119196`},
{0, 0.33504538978074816`, 0.256132905175892`, 0.0016617858251372995`},
{0, 0.37097564355830726`, -0.03575247849541091`, 0.1665183633794433`},
{0, 0.37507484064199426`, -0.06280527015275122`, 0.14788240243852177`},
{0, 0.3774580162329546`, -0.08416273725065143`, 0.12924644149760023`},
{0, 0.3779249463635693`, -0.09982487978911159`, 0.11491108692766056`},
{0, 0.3818158505457779`, -0.10979169776813169`, 0.08910744870176919`},
{0, 0.3850735819245613`, -0.11406319118771174`, 0.06617088138986574`},
{0, 0.3571135001050445`, -0.02151416709681081`, 0.1966226079763166`},
{0, 0.3537329768656702`, -0.0015805311387706023`, 0.20379028526128642`}}},
trajectories = Reap[
Table[NDSolve[{x'[t] == px[t], px'[t] == -(x[t] + 2 x[t]* y[t]),
y'[t] == py[t], py'[t] == -(y[t] + x[t]^2 - y[t]^2),
x[0] == Part[icv[[i]], 1], px[0] == Part[icv[[i]], 2],
y[0] == Part[icv[[i]], 3], py[0] == Part[icv[[i]], 4]}, {x,
px, y, py}, {t, 0, 5000}, MaxSteps -> \[Infinity],
Method -> {"EventLocator", "Event" -> x[t],
"EventAction" :> Sow[{y[t], py[t]}]}], {i, 1, Length[icv]}]][[1]];]
(*A trajectory*)
tr = ParametricPlot[Evaluate[{x[t], y[t]} /. trajectory[[2]]], {t, 0, 500}, PlotPoints -> 500, PlotStyle -> {Blue,Thickness[0.002]}, AxesStyle -> Black, LabelStyle -> Directive[Black, Small]];
A trajectory:
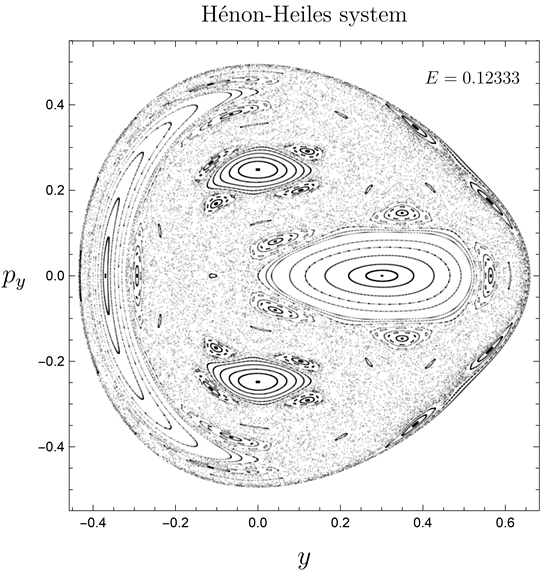
Chaotic regime:
Interactive way:

