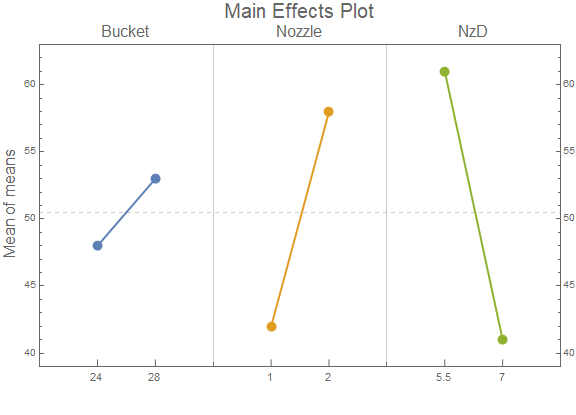
Using RectangleChart with a custom ChartElementFunction:
ClearAll[mainEffectsChart, cEF, preProcess]

cEF = {AbsolutePointSize[10], Point[{Mean @ #[[1]], #[[2, 2]]}], GrayLevel[.4],
    Text[Style[#3[[1, 1]], 11], Offset[{0, -5}, {Mean[#[[1]]], #3[[1, 2]]}], {0, 1}],
    Line[Table[ Offset[{0, i}, {Mean[#[[1]]], #3[[1, 2]]}], {i, 0, 7}]]} &;

preProcess = Module[{min = Min@# - .1 Abs[Subtract@@#] & @ MinMax[#[[All, All, -1]]]},
    Module[{ll = Length @ #}, Rule[{1/ll, #2}, {#, min}] & @@@ #] & /@ #] &;

mainEffectsChart = Module[{data = preProcess @ #,
     colors = ColorData[97] /@ Range[Length @ #],
     labels = #2,
     means = #[[All, All, -1]],
     gl = 3/2 Range[Length@# - 1],
     yrange = (# + {-.1, .1} Abs[Subtract @@ #]) & @ MinMax @ #[[All, All, -1]]},
   ReplaceAll[l_Line :> {Thick, Last[colors = RotateLeft[colors]], l}]@
     RectangleChart[data,
      Joined -> {{Mean@#[[1]], #[[2, 2]]} &},
      Frame -> True,
      ChartStyle -> {colors, None},
      GridLines -> {gl, {{Mean@Flatten@means, Dashed}}},
      BarSpacing -> {0, .5},
      PlotRange -> {{0, 3/2 Length@data}, yrange},
      ImagePadding -> {{Automatic, Automatic}, {Scaled[.05], Automatic}},
      PlotRangePadding -> 0,
      FrameTicks -> {{Automatic, All},
        {Automatic, Thread[{3/4 + Prepend[gl, 0], labels, 0}]}},
      ChartElementFunction -> cEF, ##3]] &;
Examples:
data = {Bucket, Nozzle, NzD};

labels = Style[#, 16] & /@ {"Bucket", "Nozzle", "NzD"};

mainEffectsChart[data, labels, ImageSize -> Large,
 FrameLabel -> {None, Style["Mean of means", 16]},
 PlotLabel -> Style["Main Effects Plot", 20]]
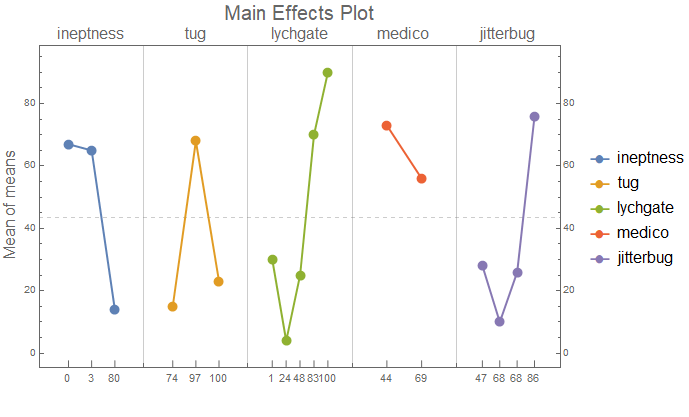
SeedRandom[1]
data3 = SortBy[First]@RandomInteger[100, {#, 2}] & /@ {3, 3, 5, 2, 4};
labels3 = Style[#, 16] & /@ RandomWord["Noun", 5];

mainEffectsChart[data3, labels3, ImageSize -> Large,
 FrameLabel -> {None, Style["Mean of means", 16]},
 PlotLabel -> Style["Main Effects Plot", 20],
 ChartLegends -> LineLegend[labels3, LegendMarkers -> {"●", 12}]]


