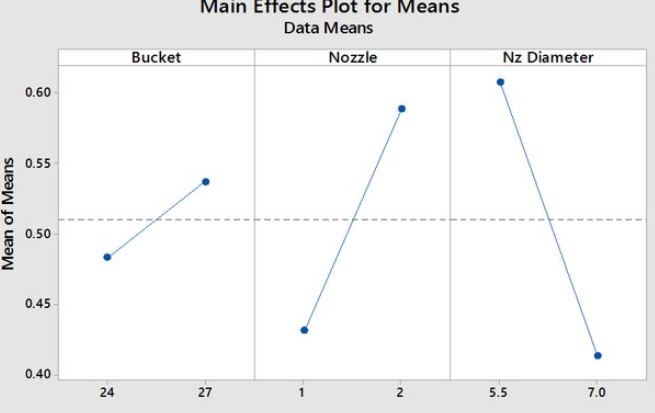
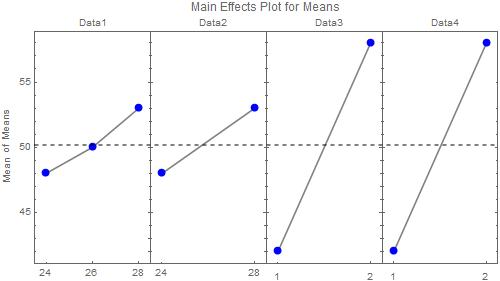
I'm trying to make a "main effect" type chart but I haven't found a way to do it in Mathematica. The main effect plots are the graphs plotting the means for each value of a categorical variable, ploted side by side. Example as follows.
Dataset:
Bucket = {{24, 48}, {28, 53}}
Nozzle = {{1, 42}, {2, 58}}
NzD = {{5.5, 61}, {7, 41}}
Thanks for the replies but I apologize for forgetting to specify that I can have more than 3 datasets (for example Dt4 = {{23, 50}, {26.55}, {28, 58}}) and that they can have more that two points. My knowledge of Mathematica does not allow me to fully understand the answers to make the necessary changes. However, all graphics (frames) must be the same width and height.


