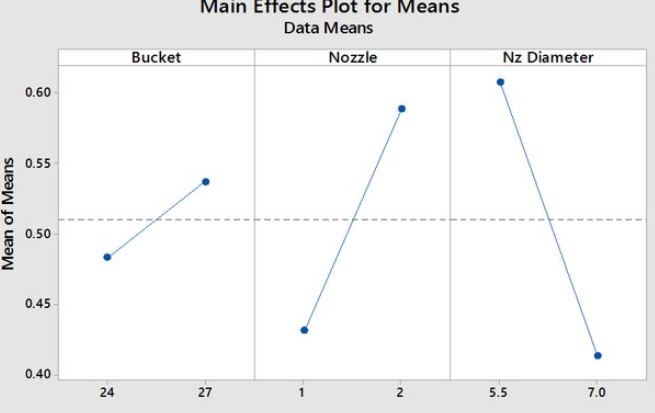
I'm trying to make a "main effect" type chart but I haven't found a way to do it in Mathematica. The main effect plots are the graphs plotting the means for each value of a categorical variable, ploted side by side. Example as follows.
How to plot a "main effect" plot?
ALEXANDRE ARARIPE
- 177
- 6

