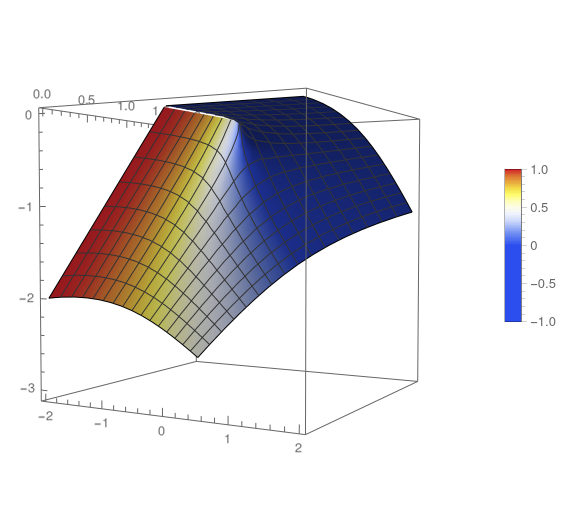
I'm making a 3D plot of the function En1 and I'm attributing its color to the sz1 function below, which contains values spanning from -1 to 1.
En1[δ_, g1_, g2_, k_] := 1/2(-I g1 + I g2 -Sqrt[-(g1 + g2 - 2 k + I δ) (g1 + g2 + 2 k + Iδ)] + δ)

vec1[δ_, g1_, g2_,k_] := {{-((I g1 + I g2 + Sqrt[-(g1 + g2 - 2 k + I δ) (g1 + g2 + 2 k + I δ)] - δ)/1), 2 k}}

vec1d[δ_, g1_, g2_,k_] := {{(I g1 + I g2 - Sqrt[-(g1 + g2 - 2 k - I δ) (g1 + g2 + 2 k - I δ)] + δ)/1, 2 k}}

σz = PauliMatrix[3];
σ0 = IdentityMatrix[2];

sz1[δ_, g1_, g2_, k_] := Flatten[vec1d[δ, g1, g2, k]. σz . Transpose[vec1[δ, g1, g2, k]]][[1]]/Flatten[vec1d[δ, g1, g2, k].Transpose[vec1[δ, g1, g2, k]]][[1]]

g1 = 1;  g2 = 1;

Plot3D[
  {Re[En1[δ, g1, g2, k]]},
  {δ, -2, 2}, {k, 0, 2},
  ColorFunction -> Function[{δ, k, z}, ColorData["TemperatureMap"][sz1[δ, g1, g2, k]]],
  ColorFunctionScaling -> False,
  PlotLegends -> BarLegend[{ColorData["TemperatureMap"], {-1, 1}}],
  BoxRatios -> {1, 1, 1}
]
As we can see, the color is responding to the function sz1. However, there is an issue with my legend since the gradient of color seems not linear. Is there a way to impose the legend color to vary linearly from -1 to 1?
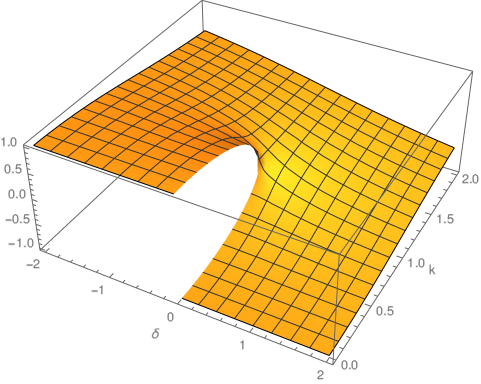
If we plot sz1 we see that it's odd with respect to the $\delta$ for a fixed k, i.e.,
Plot3D[{sz1[δ, g1, g2, k]}, {δ, -2, 2}, {k, 0, 2}, AxesLabel -> {"δ", "k"}]
However, the color of the 3D plot of Re[En1] is not odd with respect to the color. Do you see any reason for this?


