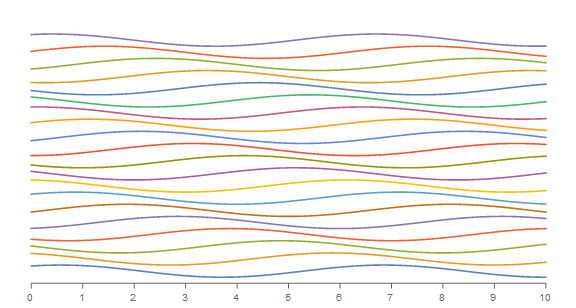
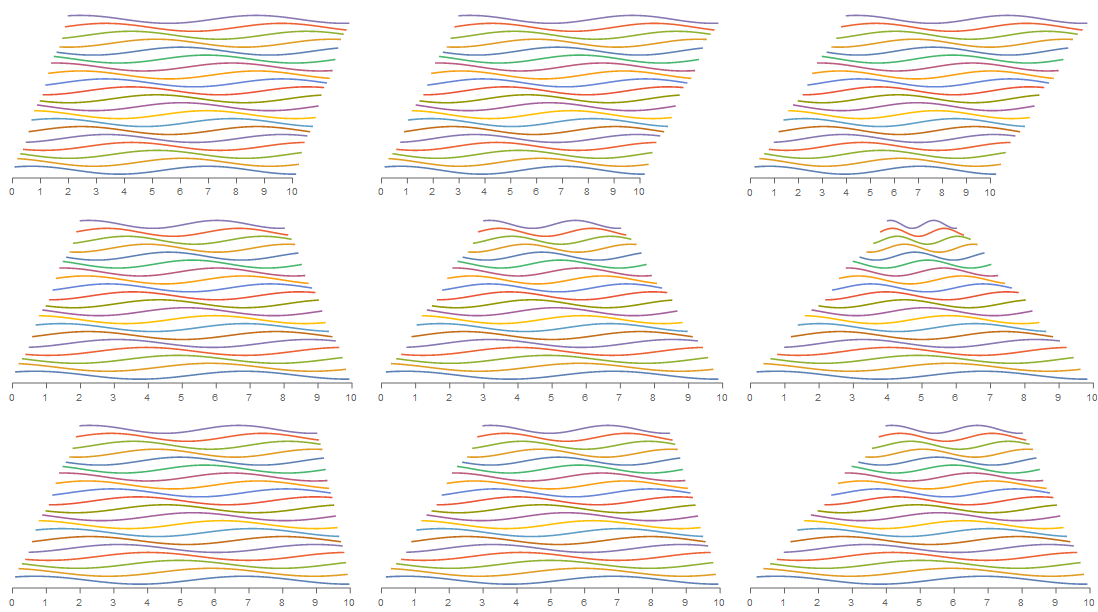
You can use TemporalData to construct your input data and then use TimeSeriesRescale on individual time series to get a perspective look/feel:
numberofseries = 20;

tds = Table[TemporalData[Table[Sin[x + i] + 2*i, {x, 0, 10, 0.1}], {0, 10}],
   {i, numberofseries}];

ClearAll[xaxis]
xaxis[a_, b_] := {GrayLevel[.4], Thickness -> Absolute[0.2],
     {Line[#[[{1, -1}]]], Line[{#, Offset[{0, -5}, #]}] & /@ #,
      Text[#[[1]], Offset[{0, -15}, #]] & /@ #} & @ Thread[{Range[a, b], 0}]};

ListLinePlot[tds, ImageSize -> Large, Axes -> False,
 Epilog -> xaxis[0, 10], AspectRatio -> 1/2, ImagePadding -> 20,
 PlotRangeClipping -> False, Ticks -> {Range[0, 10], All}]
ClearAll[rescaleTD]
rescaleTD[ls_: .1, rs_: .1] := MapIndexed[TimeSeriesRescale[#,
   Flatten[# /@ {"FirstTimes", "LastTimes"}] + {ls, rs} #2[[1]]] &, #] &;

Grid @ Transpose @
    (ListLinePlot[#, ImageSize -> 360, Axes -> False,
        Epilog -> xaxis[0, 10], AspectRatio -> 1/2,
        ImagePadding -> {{5, 5}, {20, 5}},
        PlotRangeClipping -> False, Ticks -> {Range[0, 10], All}] & /@
     Through[{rescaleTD[#, #], rescaleTD[#, -#], rescaleTD[#, -#/2]} @ tds] & /@
     {.1, .15, .2})


