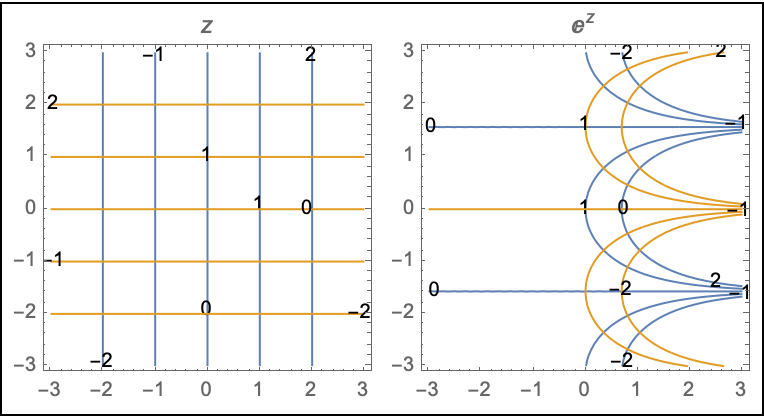
You could use ComplexContourPlot for visualising the real and imaginary axes on the complex z plane under the complex exponential mapping Exp[z].
Define function for complex mapping:
f[z_] := Exp[z]
Then use ComplexContourPlot for visualising the contours:
Edit: Contours and ContourLabels added to ComplexContourPlot following Michael E2 comment. This shows more clearly that the same lines are displayed in both contour plots.
{ComplexContourPlot[ReIm[z], {z, -3 - 3 I, 3 + 3 I}, PlotLabel -> z,
   Contours -> {Range[-2, 2]}, ContourLabels -> All],
  ComplexContourPlot[ReIm[f[z]], {z, -3 - 3 I, 3 + 3 I},
   PlotLabel -> f[z], Contours -> {Range[-2, 2]},
   ContourLabels -> All]} // Grid[{#}, Frame -> True] &
The result:

