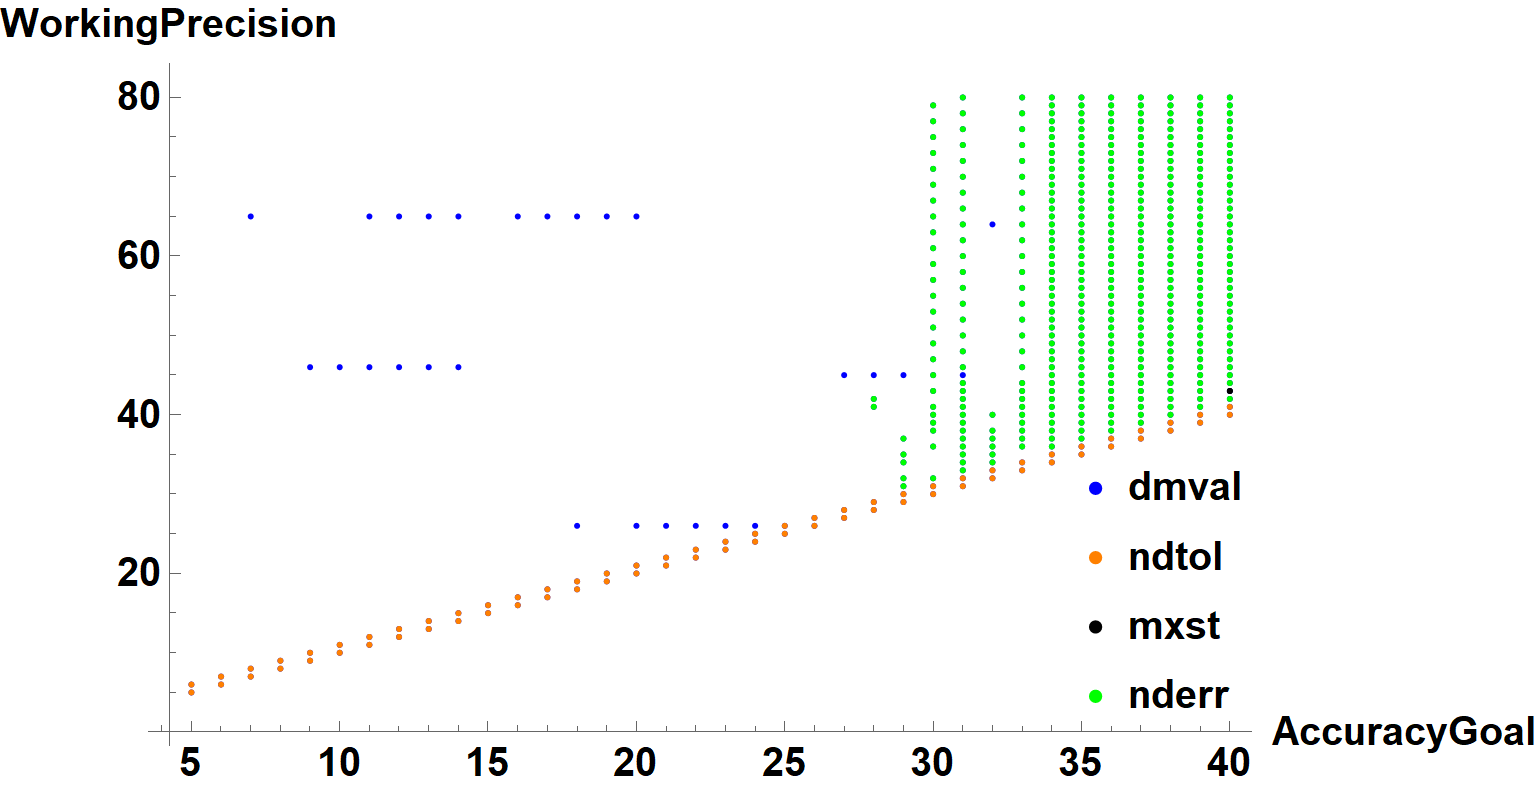
bads[1/4, 1/16] generates four distinct error messages, in addition to General::stop, which limits the number of identical errors printed. They are
Do[test[1/4, 1/16, x, y], {x, 5, 40}, {y, x, 80}]; $MessageList // Union // Rest
(* {HoldForm[InterpolatingFunction::dmval], HoldForm[NDSolveValue::mxst],
    HoldForm[NDSolveValue::nderr], HoldForm[NDSolveValue::ndtol]} *)
InterpolatingFunction::dmvaloccurs here when integration stops before reachingx = 0NDSolveValue::ndtoloccurs when the requestedPrecisionGoalandAccuracyGoalare too large in comparison withWorkingPrecisionNDSolveValue::mxstoccurs when the number of integration steps exceedsMaxStepsNDSolveValue::nderris an inexplicable error often associated with largeWorkingPrecision
The ListPlot in the question can be modified to distinguish among these errors, for instance,
which is intended to indicate the primary error. Of course, multiple errors can occur from a single call to NDSolveValue, and almost any other error also causes InterpolatingFunction::dmval. As noted in my earlier comment, in those instances where it is the only error, the integration has inexplicably stopped just short of the endpoint. Adjusting the endpoint slightly seems to solve the problem here. NDSolveValue::ndtol is resolved by increasing WorkingPrecision or (here) decreasing AccuracyGoal. NDSolveValue::mxst, is eliminated simply by increasing MaxSteps. Method -> "StiffnessSwitching" sometimes eliminates NDSolveValue::nderr, and sometimes not.

