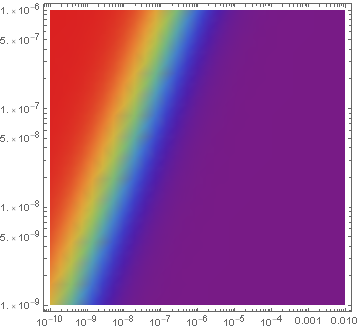
dp = DensityPlot[20*y/(0.2 y + 0.8 x), {x, 1/10^10, 1/10^2}, {y, 1/10^9, 1/10^6},
   ScalingFunctions -> {"Log", "Log"}, ColorFunction -> "Rainbow"];
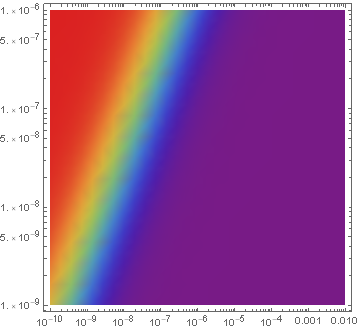
Post-process dp to change the default number of major and minor ticks ({6,6}) to {8,6} for the bottom and top frames:
Replace[dp, {vt : {_, _}, {bt : Charting`ScaledTicks[{Log, Exp}],
    tt_}} :> {vt, {bt[#, #2, {8, 6}] &, tt[#, #2, {8, 6}] &}}, All]
Alternatively,
{leftticks, rightticks} = #[{Log, Exp}][Log[1/10^9], Log[1/10^6], {6, 6}] & /@
    {Charting`ScaledTicks, Charting`ScaledFrameTicks};
{bottomticks, topticks} = #[{Log, Exp}][Log[1/10^10], Log[1/10^2], {8, 6}] & /@
    {Charting`ScaledTicks, Charting`ScaledFrameTicks};

Show[dp, FrameTicks -> {{leftticks, rightticks}, {bottomticks, topticks}}]


