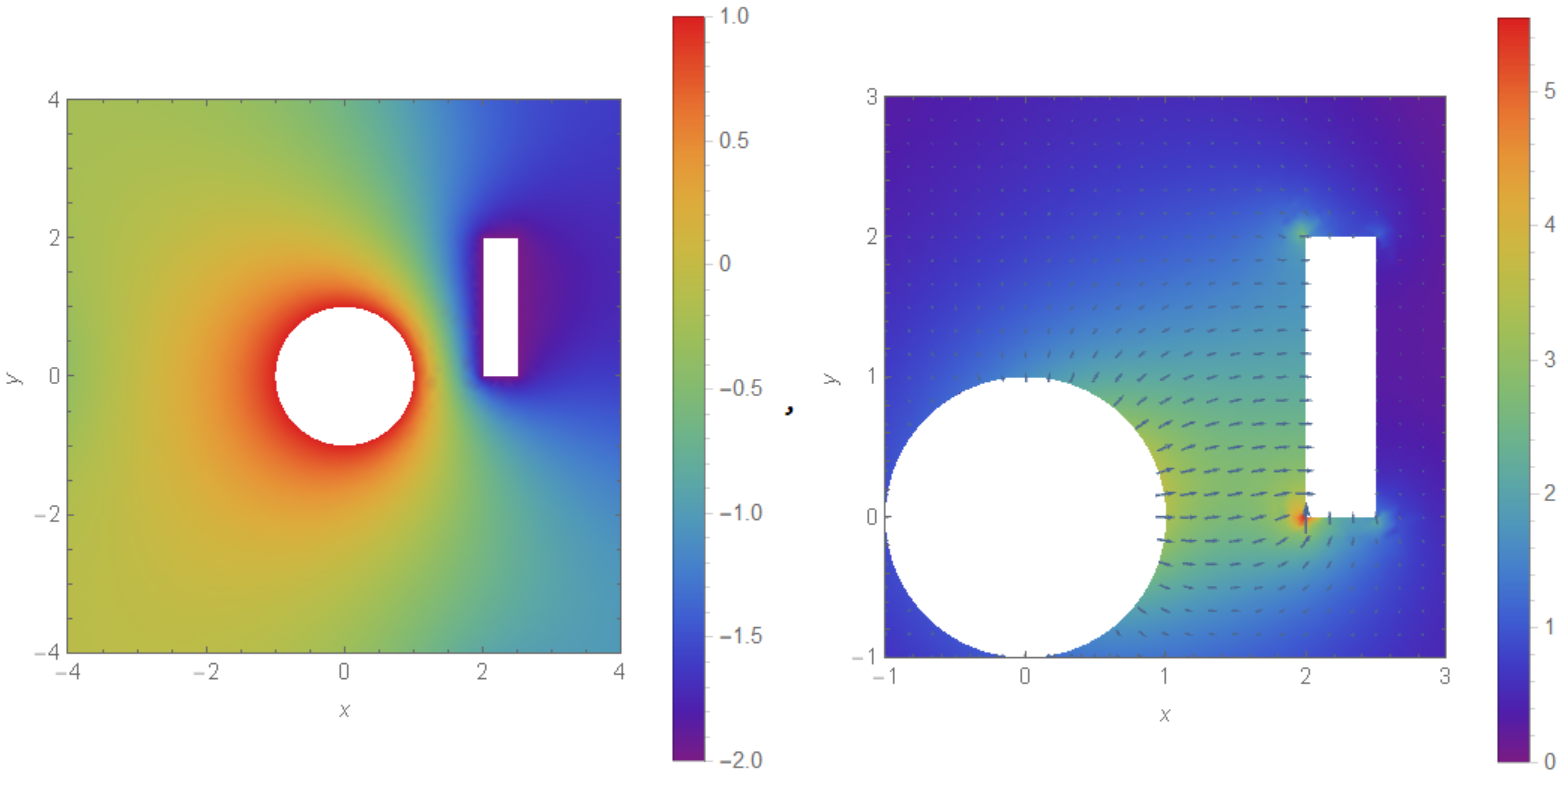
In the case of two metal objects, we can set the potential of each object as $V_1, V_2$. Then the code for a numerical solution in 2D is
Needs["NDSolve`FEM`"];
(*Define Boundaries*)air = Rectangle[{-5, -5}, {5, 5}];
object1 = Disk[];
object2 = Rectangle[{2, 0}, {2.5, 2}]; reg12 =
 RegionUnion[object1, object2];
reg = RegionDifference[air, reg12];
mesh = ToElementMesh[reg,
  MeshRefinementFunction ->
   Function[{vertices, area},
    area > 0.001 (0.1 + 10 Norm[Mean[vertices]])]]
mesh["Wireframe"]
eq = Laplacian[u[x, y], {x, y}]; V1 = 1; V2 = -2;
bc = {DirichletCondition[u[x, y] == V1, x^2 + y^2 == 1],
   DirichletCondition[
    u[x, y] ==
     V2, (x == 2 || x == 2.5 && 0 <= y <= 2) || (y == 0 ||
       y == 2 && 2 <= x <= 2.5)]};
U = NDSolveValue[{eq == 0, bc}, u, {x, y} \[Element] mesh];

ef = -Grad[U[x, y], {x, y}];
Visualisation of solution
{DensityPlot[U[x, y], {x, y} \[Element] reg,
  ColorFunction -> "Rainbow", PlotLegends -> Automatic,
  FrameLabel -> Automatic, PlotPoints -> 50,
  PlotRange -> {{-4, 4}, {-4, 4}}],
 StreamDensityPlot[Evaluate[ef], {x, y} \[Element] reg,
  ColorFunction -> "Rainbow", PlotLegends -> Automatic,
  FrameLabel -> {x, y}, StreamStyle -> LightGray,
  VectorPoints -> Fine, PlotRange -> {{-1, 3}, {-1, 3}}]}
Update 1. Next code is devoted to solve electrostatic problem for combination of dielectric and conducting objects (glass cylinder and metal strip). For dielectric we put electric charge $q_1$, and for metal we put potential $V_2$. Code:
Needs["NDSolve`FEM`"];
par = {eps1 -> 3.5, eps2 -> 1.0}; air =
 Rectangle[{-5, -5}, {5, 5}];
object1 = Disk[]; q1 = 1; vol1 =
 NIntegrate[1, {x, y} \[Element] object1]; rho1 = q1/vol1;
object2 = Rectangle[{2, 0}, {2.5, 2}];
rho[x_, y_] := rho1 Boole[{x, y} \[Element] object1];
eps[x_, y_] :=
 eps2 + (eps1 - eps2) Boole[{x, y} \[Element] object1]; reg =
 RegionDifference[air, object2];
mesh = ToElementMesh[reg,
  MeshRefinementFunction ->
   Function[{vertices, area},
    area > 0.001 (0.1 + 10 Norm[Mean[vertices]])]]
mesh["Wireframe"]
 V2 = -2; eq =
 Inactive[Div][
   eps[x, y] Inactive[Grad][u[x, y], {x, y}], {x, y}] == -2 Pi rho[x,
    y]; bc =
 DirichletCondition[u[x, y] == V2, {x, y} \[Element] object2];
U = NDSolveValue[{eq /. par, bc}, u, {x, y} \[Element] mesh];

ef = -Grad[U[x, y], {x, y}];
Visualisation
{DensityPlot[U[x, y], {x, y} \[Element] mesh,
  ColorFunction -> "Rainbow", PlotLegends -> Automatic,
  FrameLabel -> Automatic, PlotPoints -> 50,
  PlotRange -> {{-4, 4}, {-4, 4}}],
 StreamDensityPlot[Evaluate[ef], {x, y} \[Element] reg,
  ColorFunction -> "Rainbow", PlotLegends -> Automatic,
  FrameLabel -> {x, y}, StreamStyle -> LightGray,
  VectorPoints -> Fine, PlotRange -> {{-1, 3}, {-1, 3}}],
 StreamDensityPlot[Evaluate[ef], {x, y} \[Element] reg,
  ColorFunction -> Hue, FrameLabel -> {x, y}, StreamStyle -> Blue,
  PlotRange -> {{-1.5, 1.5}, {-1.5, 1.5}}, PlotLegends -> Automatic]}


