radii = Range[10];
ClearAll[tr]
tr[n_] := (n^2 - 1)/2;
You can use tr and radii with
###ContourPlot
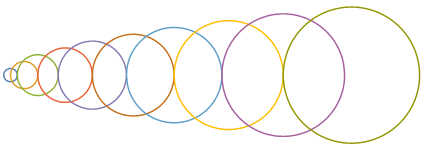
ContourPlot[Evaluate[(x - tr[#])^2 + y^2 == #^2 & /@ radii],
  {x, -1, 65}, {y, -10, 10},
  ContourStyle -> Thick, AspectRatio -> Automatic,  Frame -> False, ImageSize -> 1 -> 5]
###ParametricPlot
ParametricPlot[Evaluate[{# Cos[t] + tr@#, # Sin[t]} & /@ radii],
 {t, 0, 2 Pi},
 AspectRatio -> Automatic, PlotStyle -> Thick, Axes -> False,
 Frame -> False, ImageSize -> 1 -> 5]
same picture
###Graphics
Graphics[{Thick, ColorData[97]@#, Circle[{tr@#, 0}, #]} & /@ radii]
same picture
###ContourPlot3D
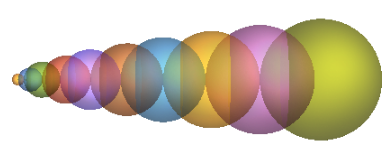
ContourPlot3D[Evaluate[(x - tr[#])^2 + y^2 + z^2 == #^2 & /@ radii],
   {x, -1, 65}, {y, -10, 10}, {z, -15, 15},
   Mesh -> None, ContourStyle -> Opacity[.5], BoxRatios -> Automatic,
   ViewPoint -> Front, Boxed -> False, Axes -> False , PlotPoints -> 60]
###ParametricPlot3D
ParametricPlot3D[Evaluate[{# Cos[u] Sin[v] + tr@#, # Sin[u] Sin[v], # Cos[  v]} & /@ radii],
  {v, 0, Pi}, {u, 0, 2 Pi},
  Mesh -> None, BoundaryStyle -> None, PlotStyle -> Opacity[.5],
  Axes -> False, Boxed -> False, BoxRatios -> Automatic, ViewPoint -> Front]
same picture
###Graphics3D
styles = "DefaultPlotStyle" /.
    (Method /. Charting`ResolvePlotTheme[Automatic, ContourPlot3D]);

Graphics3D[{Opacity[.5], styles[[#]], Sphere[{tr @ #, 0, 0}, #]} & /@ radii,
  Boxed -> False, ViewPoint -> Front]
same picture


