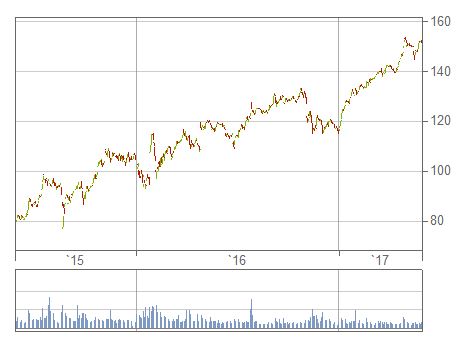
Just for Quandl. You can use Qusndl's API guide and customize the data. For example, first download historical data for FaceBook.
stDate = "2015-05-31";
endDate = "2017-05-31";
mysymbol = "WIKI/FB";
yourapikey = "..."; (*you need to supply your freely available quandl api key*)
data = Import[StringJoin["https://www.quandl.com/api/v3/datasets/", mysymbol,
    "/data.csv?start_date=", stDate, "&end_date=", endDate,
    "&order=asc&api_key=", yourapikey]];
First[data]
Then convert "Open", "High", "Low", "Close", "Volume" into a time seires.
dates = ToExpression[StringSplit[data[[2 ;;, 1]], "-"]];
datav = data[[2 ;;, {2, 3, 4, 5, 6}]];
datats = TimeSeries[datav, {dates}];
Then you can use TradingChart to chart the data.
TradingChart[datats]

